Tracking Global Trade Routes, Chokepoints, and Freight Costs in Real Time
Key Takeaways: Strait of Hormuz traffic down 94.4%. World Monitor tracks 8 corridors, 9 freight indices, WTO trade policy, and critical mineral concentration across one free dashboard. Data updates in real time.
The Strait of Hormuz carries 20% of the world’s oil. Right now, World Monitor’s live chokepoint tracker shows traffic has dropped 94.4% week-over-week. Tanker transits have collapsed from 60+ daily to single digits. The disruption score is 99%.
This is not a hypothetical scenario for a risk assessment deck. This is happening right now, and World Monitor is tracking it live.
Data as of March 15, 2026. Values update in real time on the dashboard.
The Hormuz Crisis in Real Time
The Iran-Israel conflict has turned the Persian Gulf into an active confrontation zone. Iranian naval blockade risks, mines reported in shipping lanes, and 1,300+ security incidents in the past seven days have effectively shut down the world’s most critical energy chokepoint.
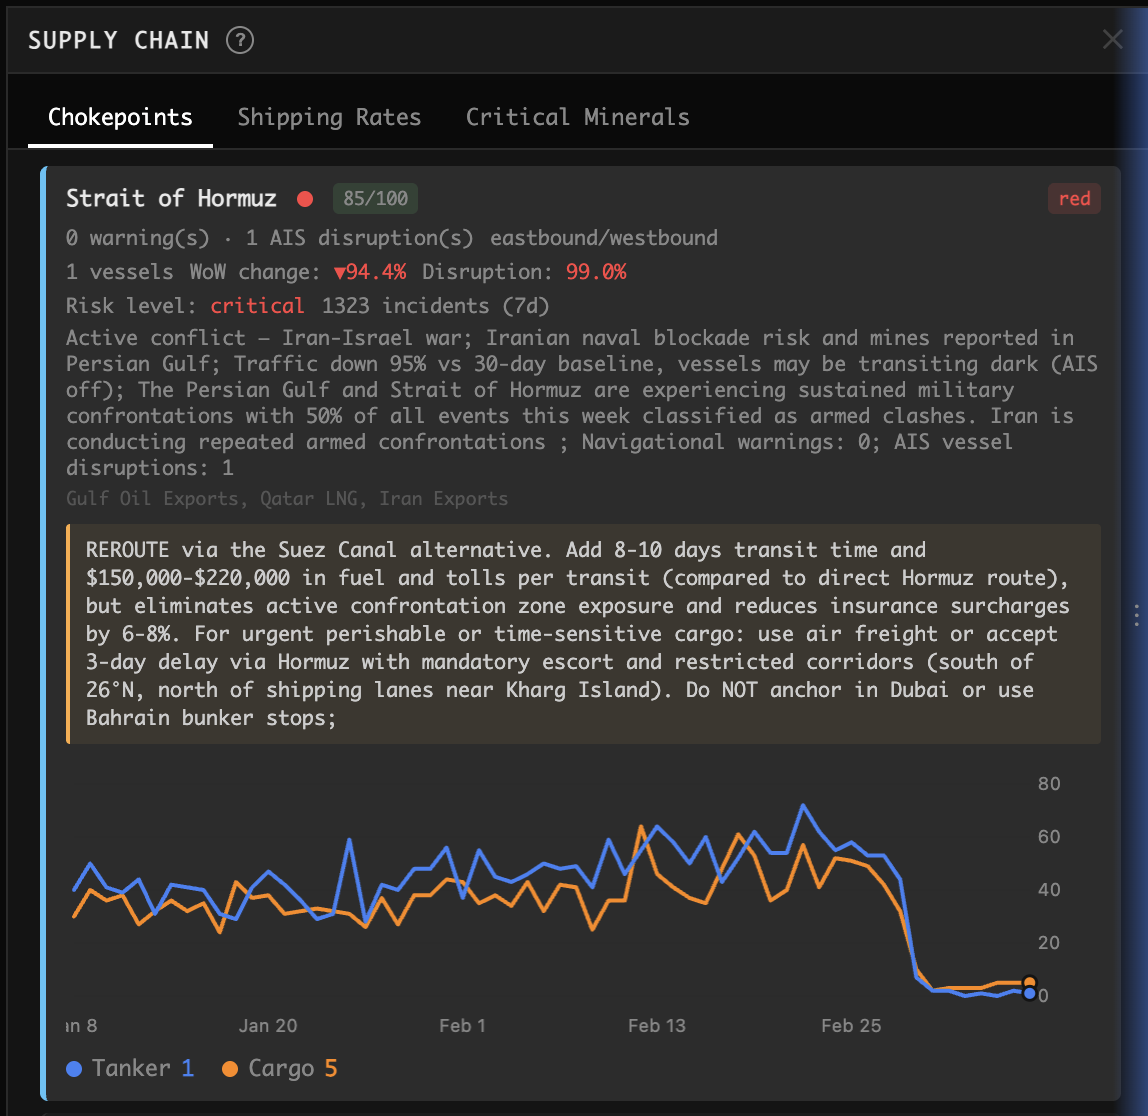
World Monitor’s Supply Chain panel shows this in one view:
- 85/100 disruption score with red status
- 94.4% week-over-week traffic decline
- 99% disruption rate across the corridor
- Transit history chart showing the cliff-edge collapse in late February
- AI-generated shipping advisory: reroute via Suez Canal (adds 8-10 days, $150,000-$220,000 per transit), avoid Dubai anchorage, suspend Iran/Iraq crude exports until confrontations cease
The chart tells the story: tanker and cargo traffic that had been steady at 40-70 vessels daily suddenly dropped to near zero. This is not a gradual decline. It is a sudden shutdown of one of the world’s most important trade arteries.
Eight Maritime Chokepoints Monitored in Real Time
The Hormuz crisis is the most severe, but it is not the only corridor under pressure. World Monitor tracks eight critical maritime chokepoints, each scored by disruption level, vessel traffic, and conflict intensity:
The following table shows the current status of all eight corridors as of mid-March 2026:
| Corridor | Status | Key Risk |
|---|---|---|
| Strait of Hormuz | Critical | Iran-Israel war, naval blockade, mines |
| Kerch Strait | Red | Russia controls Kerch Bridge, Azov grain exports restricted |
| Bab el-Mandeb | Yellow | Houthi attacks on commercial shipping |
| Suez Canal | Yellow | Red Sea conflict spillover, Iran-Israel war adjacency |
| Bosporus Strait | Elevated | Black Sea grain corridor tensions |
| Taiwan Strait | Yellow | PLA military exercises, semiconductor supply risk |
| Cape of Good Hope | Green | Rerouting destination for Hormuz/Suez diversions |
| Dover Strait | Green | Europe’s busiest shipping lane, currently stable |
Each corridor shows live vessel counts, week-over-week traffic changes, disruption percentages, and risk levels. When you click a corridor, you get the full AI-generated situation assessment with specific shipping recommendations.
What Makes This Different From Port Trackers
Traditional maritime tracking tools show you where ships are. World Monitor shows you why they are not where they should be.
The corridor disruption table cross-references AIS vessel data with conflict events, navigational warnings, and military activity. When vessel counts drop in the Strait of Hormuz, the system does not just show a number going down. It tells you there are 1,323 security incidents in the past week, Iranian naval confrontations in the shipping lanes, and mines reported in the Persian Gulf.
The AI advisory goes further: it recommends specific alternative routes, estimates the cost increase per transit, identifies which cargo types should use air freight instead, and warns against specific anchorage points.
Real-Time Freight Cost Tracking
When chokepoints close, freight costs spike. World Monitor tracks nine freight indices that quantify the cost impact of disruptions:
Container Rates:
- SCFI (Shanghai Containerized Freight Index): composite container shipping costs from Shanghai, the world’s busiest port. Currently at 1,710, up 14.9% as rerouting demand increases
- CCFI (China Containerized Freight Index): broader Chinese container export costs. At 1,072, up 1.7%
Bulk Shipping:
- BDI (Baltic Dry Index): the benchmark for dry bulk shipping costs (iron ore, coal, grain). At 1,972, up 2.4%
- BCI (Baltic Capesize Index): largest vessels, long-haul routes. At 2,721, up 5.7%, reflecting longer Cape of Good Hope diversions
- BPI (Baltic Panamax Index): mid-size vessels, grain and coal. At 1,835
- BSI (Baltic Supramax Index): regional trade vessels. At 1,290
- BHSI (Baltic Handysize Index): smaller vessels, coastal trade. At 807
Economic Indicators:
- Deep Sea Freight Producer Price Index (BLS): long-term freight cost trends with 24-month history
- Freight Transportation Services Index (BTS): overall freight sector activity
When you see the Hormuz disruption score at 99% and the Capesize Index up 5.7% in the same dashboard, the connection is immediate: ships that would have taken the short route through Hormuz are now going around Africa, and the cost of booking those larger vessels is climbing. For more on how these costs ripple into commodity markets, see our commodity monitoring guide.
Trade Policy Intelligence
Supply chain disruptions do not happen in isolation. They intersect with trade policy: tariffs, restrictions, and barriers that shape where goods can flow even when shipping lanes are open.
World Monitor’s Trade Policy panel tracks:
- Trade Restrictions: WTO-reported measures by country, showing which economies are tightening import/export controls
- Tariff Trends: applied tariff rates between major trading partners over time
- Trade Flows: bilateral trade volumes between economies (e.g., US-China, US-EU), tracking shifts in trade patterns
- Trade Barriers: SPS (Sanitary and Phytosanitary) and TBT (Technical Barriers to Trade) measures that create non-tariff obstacles
- US Customs Revenue: Treasury collection data that reflects real trade volumes hitting US ports
When the Strait of Hormuz closes, the trade policy data shows the second-order effects: which countries depend on Gulf oil imports, which alternative suppliers face their own trade restrictions, and whether tariff structures make rerouting economically viable.
Critical Minerals: Concentration Risk
Some supply chains cannot be rerouted because the supply itself is concentrated in a handful of countries. The Critical Minerals tab tracks this concentration risk using the HHI (Herfindahl-Hirschman Index), where anything above 2,500 indicates high concentration:
| Mineral | Top Producer | Share | HHI Score | Risk |
|---|---|---|---|---|
| Gallium | China | 96% | 9,280 | Critical |
| Cobalt | DRC | 80% | 6,633 | Critical |
| Germanium | China | 77% | 6,085 | Critical |
| Rare Earths | China | 71% | 5,327 | Critical |
| Lithium | Australia | 50% | 3,529 | High |
Gallium at 9,280 means the global supply is almost entirely dependent on a single country. When China announced gallium and germanium export controls in 2023, the semiconductor industry had no short-term alternative. World Monitor makes this concentration visible, so supply chain teams can assess exposure before restrictions are announced.
How It All Connects
Consider the current Hormuz crisis through all four dimensions:
- Chokepoints: Hormuz at 99% disruption, vessels rerouting to Suez and Cape of Good Hope
- Freight Costs: Capesize Index up 5.7% (longer routes need bigger ships), SCFI up 14.9% (container demand shifting)
- Trade Policy: Gulf oil exports affected by the conflict, alternative suppliers face their own trade barriers
- Critical Minerals: Qatar LNG exports transit Hormuz. Disruption affects downstream petrochemical inputs for battery manufacturing
No single data source shows this full picture. World Monitor puts chokepoint status, freight indices, trade policy, and mineral supply risk in one panel, updated in real time. Combined with AI-powered forecasting, you can see not just what is happening, but where the situation is heading.
The Data Sources
Transparency matters. Here is where the data comes from:
- Vessel transit data: AIS (Automatic Identification System) feeds, cross-referenced with historical baselines
- Conflict events: ACLED (Armed Conflict Location & Event Data Project), 7-day rolling windows
- Shipping advisories: AI-generated from combined conflict, navigational, and AIS disruption signals
- Container indices: Shanghai Shipping Exchange (SSE) public JSON API
- Bulk indices: Baltic Exchange via HandyBulk daily reports
- Economic indices: FRED (Federal Reserve Economic Data)
- Trade policy: WTO I-TIP (Integrated Trade Intelligence Portal)
- Critical minerals: USGS mineral commodity data with HHI calculations
All sources are public. No proprietary data feeds. No paywall.
Frequently Asked Questions
What is the Baltic Dry Index (BDI)?
The BDI measures the cost of shipping dry bulk commodities (iron ore, coal, grain) on major ocean routes. It is widely used as a leading indicator of global trade activity because it reflects real demand for shipping capacity, not speculation.
How does the Strait of Hormuz affect oil prices?
Roughly 20% of the world’s oil supply and 25% of global LNG passes through Hormuz. When traffic drops or the strait is threatened, energy markets price in supply disruption risk. The current 94.4% traffic decline is one of the most severe disruptions in the strait’s history.
What are the world’s most critical shipping chokepoints?
The eight most strategically important chokepoints are: Strait of Hormuz (oil/LNG), Strait of Malacca (Asia-Europe trade), Suez Canal (Mediterranean access), Bab el-Mandeb (Red Sea entry), Panama Canal (Atlantic-Pacific), Bosporus Strait (Black Sea grain), Taiwan Strait (semiconductors), and Dover Strait (North Sea). World Monitor tracks all of these except Malacca and Panama, which are currently low-risk.
Open the Supply Chain panel at worldmonitor.app and click “Chokepoints” for live corridor disruption scores, or “Shipping Rates” to see real-time freight indices. Free for everyone.