Free global intelligence dashboard · live now

By the time it's news,
you already knew.

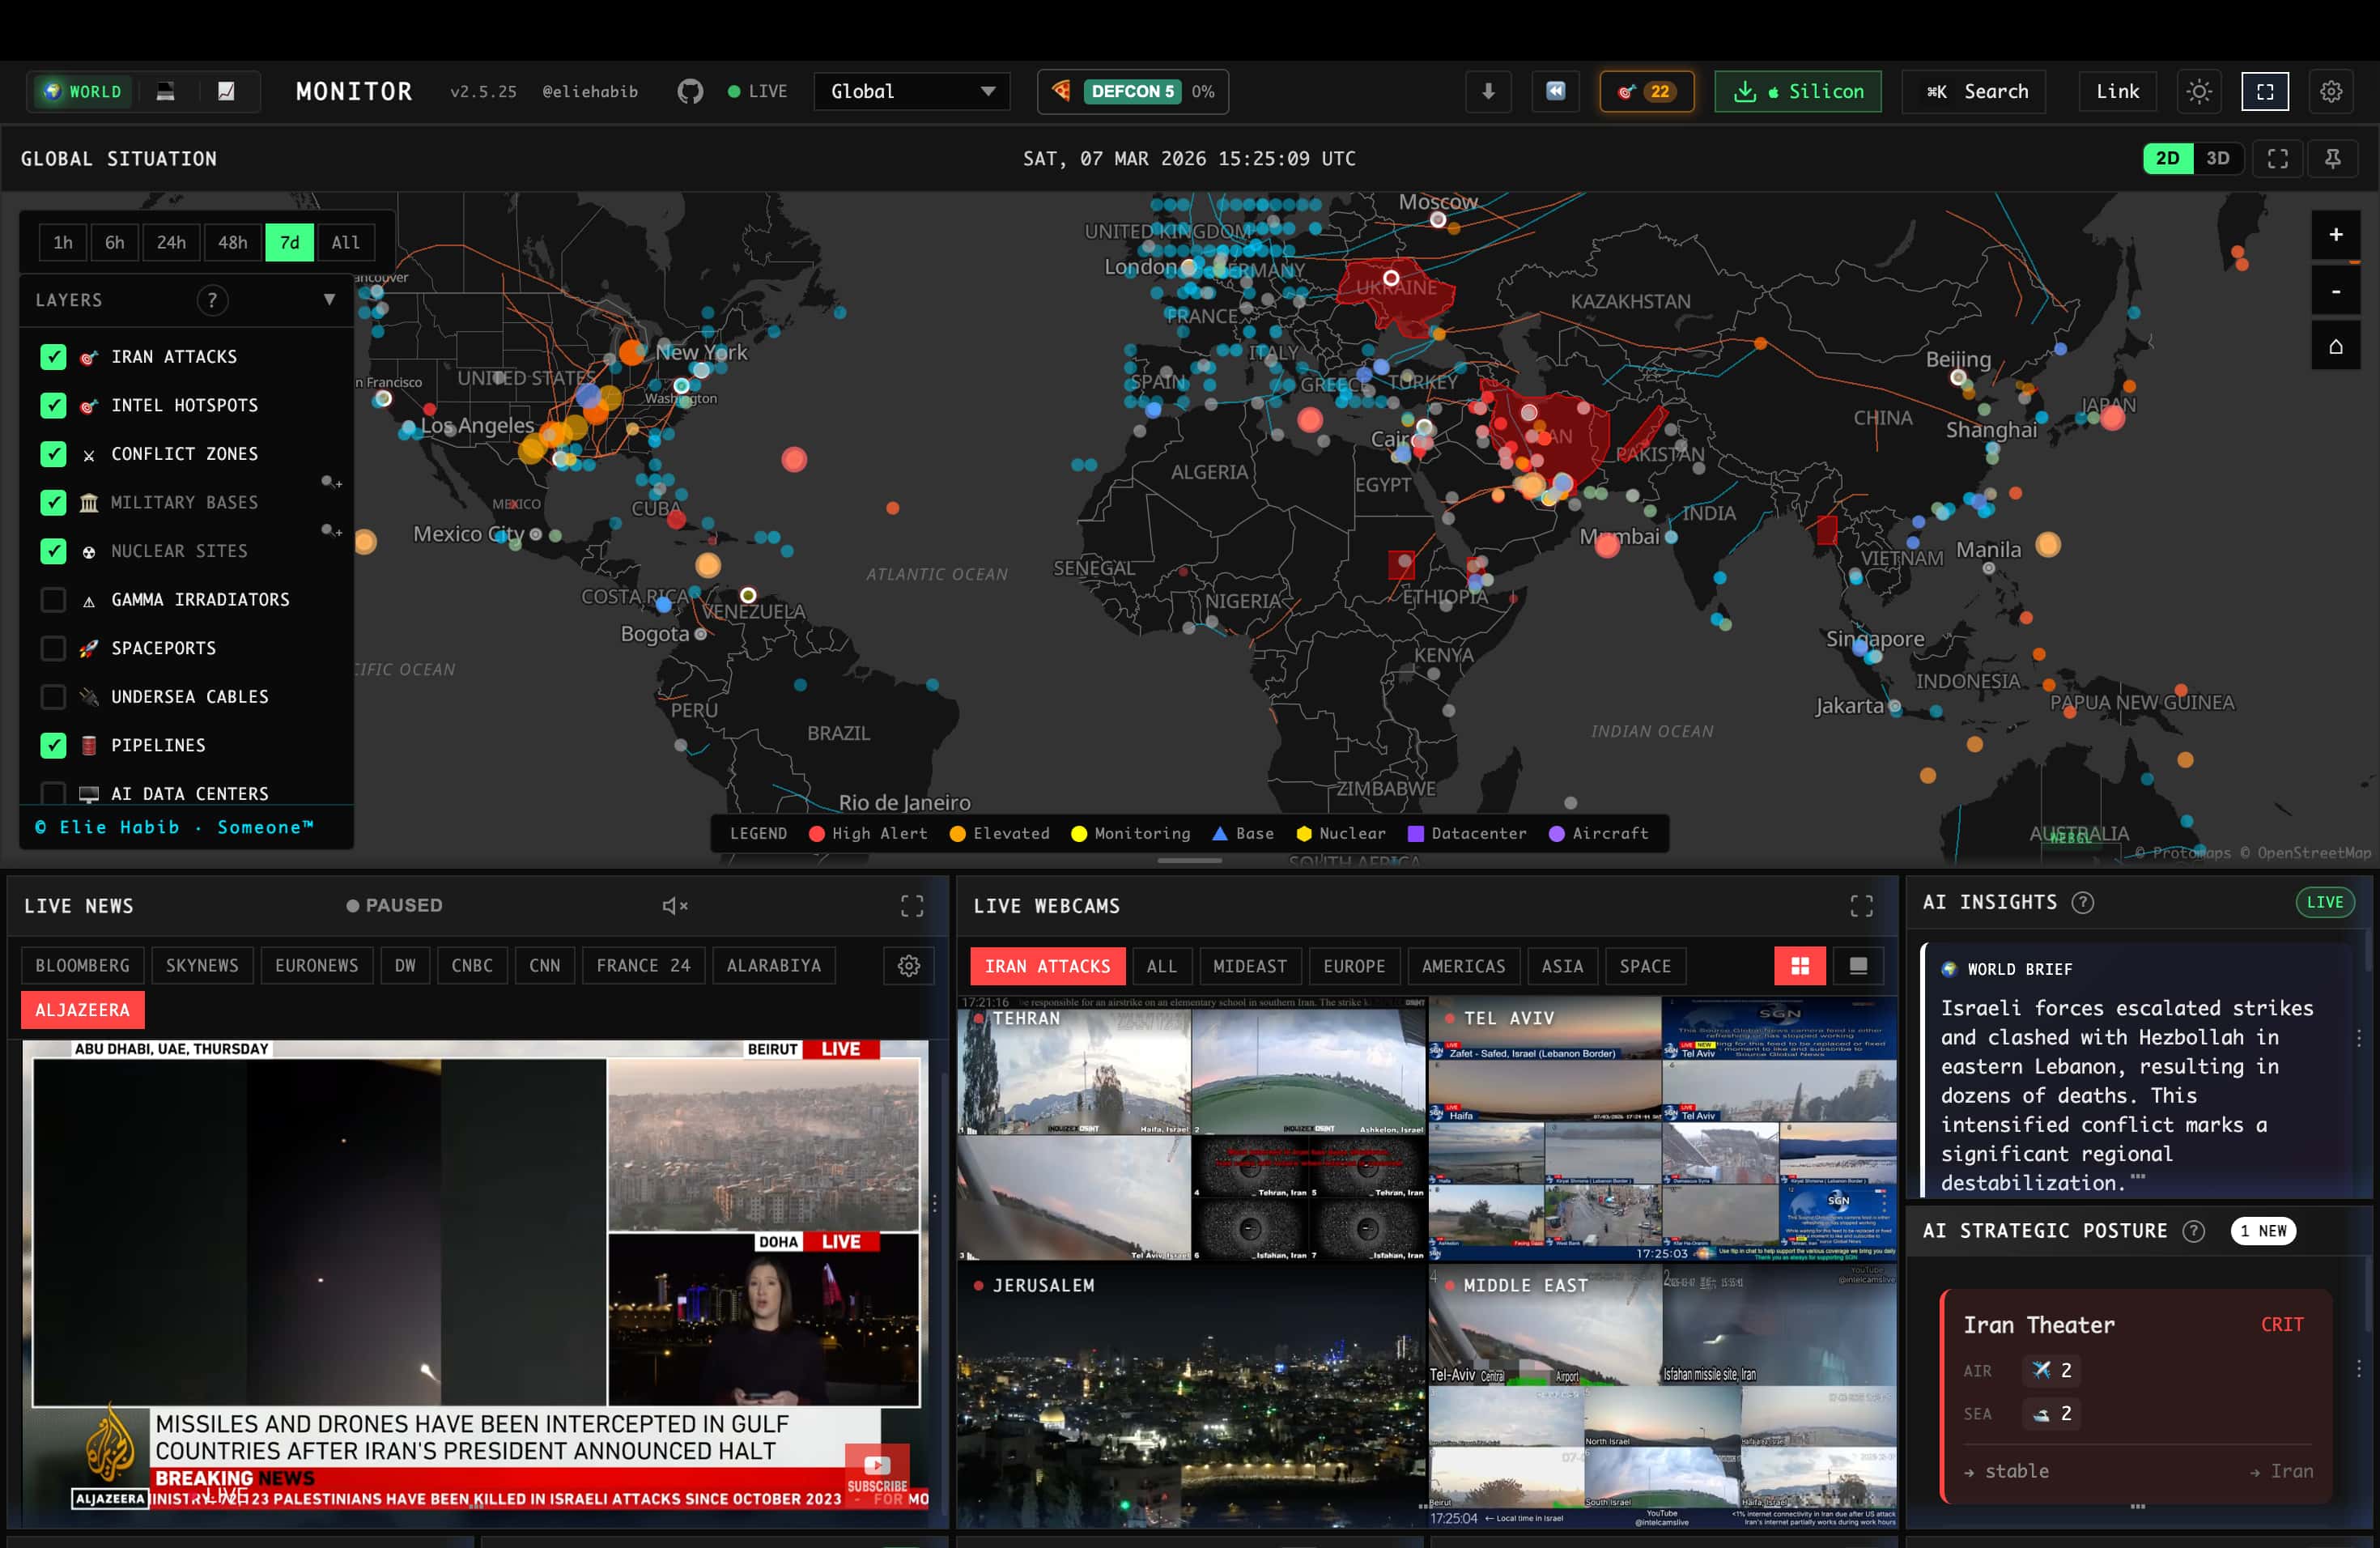
Headlines are the lag. World Monitor streams the world's raw signals — ships, jets, sirens, cables, markets — onto one live map, with AI that flags when they converge into something that matters.

Free · No signup · Loads in seconds
56
Map layers
500+
Curated feeds
65+
Data providers
5
Independent alert origins
Live right now

This page is plugged into the same APIs as the dashboard.

Four of the hundred-plus signals World Monitor watches around the clock.

Top signals
Sample
  • Security council convenes emergency session on Red Sea shipping attacksReuters
  • Major central banks signal divergence ahead of rate decisionsFinancial Times
  • Undersea cable disruption slows traffic across two regionsAP
  • Satellite imagery shows expanded activity at contested borderBBC
Instability index
Sample
  • 🇺🇦 UA78
  • 🇮🇱 IL71
  • 🇮🇷 IR66
  • 🇷🇺 RU62
  • 🇵🇰 PK54

12 fused signals per country

Maritime chokepoints
Sample

3 of 13 disrupted

  • Bab el-Mandeb82
  • Strait of Hormuz45
  • Suez Canal38
  • Panama Canal12
  • Strait of Malacca8
Markets
Sample
Up
7/11
Best
CU +1.5%
Weakest
BTC -1.2%
  • S&P 500equity6,053+0.42%
  • Nasdaqequity20,232+0.67%
  • VIXvol18.42-2.15%
  • Bitcoincrypto104,850-1.23%
  • Ethereumcrypto2,524-0.74%
  • WTI crudeenergy72.44+1.18%
  • Brentenergy76.18+1.04%
  • Goldmetal3,312+0.31%
  • Coppermetal4.91+1.46%
  • Nat gasenergy3.18-0.58%
  • EUR/USDfx1.08+0.12%
  • USD/JPYfx144.20-0.21%
Correlation engine

The edge is seeing the signals move together.

You can find the feeds in a hundred places. The edge is one surface where geopolitics, shipping, commodities, macro, markets, weather, infrastructure, cyber, news and country risk can explain each other.

Geopolitics + markets + macro

The market move
has a map.

Signals fused
RISK

Country risk, sanctions, hotspot escalation, official alerts and news velocity show where geopolitical pressure is rising.

FLOW

Ships, chokepoints, flights, cables and infrastructure proximity show whether that pressure can hit supply, trade or capital routes.

MACRO

Rates, FX, equities, crypto, energy and safe-haven assets show which market regime is repricing.

PRICE

Correlation

The edge is seeing geopolitical pressure, transmission path and price action together before it becomes a consensus note.

Country riskTrade flowsRates + FXEquities + crypto
Open the market lens →

Commodities + chokepoints + weather

Commodity moves start
in the physical world.

Signals fused
AIS

AIS, ports, pipelines, LNG, refineries, waterways and chokepoints show when supply is slowing, rerouting or concentrating.

WEATHER

Weather, fires, earthquakes, outages and conflict layers show the physical events that can hit production or transport.

SUPPLY

Oil, gas, gold, grains, miners, shipping names and commodity-linked currencies show how the shock prices through.

SPREAD

Correlation

Commodity intelligence only works when physical flow, disruption signal and market spread are visible together.

AIS + portsWeather + firesEnergy assetsOil/gold/grains
Open the commodity lens →

AI infrastructure + energy + climate

The AI boom has
a physical balance sheet.

Signals fused
AI

AI datacenters sit beside grids, pipelines, LNG, nuclear facilities, cloud regions and power-market exposure.

GRID

Grid stress, outages, heat, fire and weather layers show which compute corridors are under pressure today.

CLIMATE

Company, exchange and macro panels show who is exposed when energy, compute and capital collide.

MARKET

Correlation

AI infrastructure risk only appears when physical assets, climate signals and markets share one screen.

AI datacentersPower assetsFires + weatherMarkets
Map AI infrastructure →

Cables + outages + trade

The cable break becomes a cascade

Signals fused
CABLE

Subsea cables, landing stations, ports, pipelines and chokepoints are mapped together.

BGP

Internet and BGP anomaly feeds show whether a physical fault is becoming a digital outage.

PORTS

Trade corridors, country resilience and redundancy data show who loses fallback routes first.

RISK

Correlation

Cable damage matters when telecom redundancy, trade corridors and country exposure line up.

86 cablesBGP + outagesPorts + pipelinesResilience
Trace a cable on the map →

Not a list of feeds. A correlation surface: when three systems move together, the map makes it visible ↓

Zero to oriented

Your first five minutes on the live map.

No tour, no empty states, no signup wall. This is what actually happens.

0:00

The map is already moving

Conflicts, vessels, flights, fires and outages render as the page loads. Nothing to configure first.

0:40

Click any country

A full dossier opens: instability score with its components, an AI brief with cited headlines, active signals, a 7-day timeline.

2:00

Hit ⌘K / Ctrl-K

154 commands. Jump to any layer, panel or country without learning the UI first.

3:30

Pick your lens

World, Tech, Finance, Commodity, Energy or Happy — same engine, six tuned monitors, one click apart.

5:00

You've seen maybe a tenth of it

The rest surfaces as the world moves — satellite passes, GPS jamming, dark ships, protest clusters, siren alerts.

Under the hood

The depth is the product.

Every number below is live in the dashboard today — not a roadmap.

56
Map layers
500+
Curated feeds
65+
Data providers
13
Chokepoints · live AIS
31
Instability index · live
196
Resilience rankings
86
Subsea cables
88
Pipelines & LNG
313
AI datacenters mapped
29
Scored hotspots
92
Exchanges & assets
39
MCP tools
154
⌘K commands
24
Languages · RTL incl.
5
Independent alert origins

Don't take the numbers on faith — open the app and count. Sources are cited on every panel.

For builders & AI agents

Your AI can use it too — a 39-tool MCP server.

Everything on the map is also a tool. Point Claude — or any MCP-compatible agent — at World Monitor and it researches with live data instead of training-data memories.

  • 39 MCP tools: risk scores, chokepoints, conflicts, markets, briefs
  • JMESPath projection on every tool — agents fetch exactly what they need
  • OAuth API with one key across 65+ upstream providers
  • Open source under AGPL-3.0 — read it, self-host it, build on it
Read the MCP docs
claude — session

> Is our Red Sea exposure getting worse this week?

get_chokepoint_status {jmespath: "chokepoints[?name=='Bab el-Mandeb']"}

get_country_risk {country: "YE"}

get_maritime_activity {region: "red_sea"}

Transit counts down week-over-week; war-risk tier elevated; two density anomalies in the last 48h.

See the full tool reference →

Access

Free is the observatory. Pro is the operations room.

The full dashboard is free — every layer, every feed, no signup. Pro adds the decision layer.

Free

$0

The free tier is a full product, not a trial. Every map layer, every feed, every monitor — no signup, no trial clock, no feature wall on the map.

  • All 56 map layers & 500+ feeds
  • Country briefs, hotspots, instability scores
  • Chokepoints, cables, cascade analysis
  • Breaking alert pipeline & watchlists
Launch Dashboard

Pro

From $39.99/mo · 2 months free when billed annually

Act on it. The decision layer used in the moments above:

  • WM Analyst — chat across 30+ live services, with citations
  • Scenario engine & Route Explorer — game disruptions before they hit
  • Personal AI digest — daily, twice-daily or weekly, to Slack, Telegram or email
  • MCP + API access — 39 tools under one key
  • Custom widget builder for your own panels
See plans & pricing
No catch

Fair questions.

Is World Monitor really free?
Yes. The full live map — every layer, 500+ feeds, country briefs, breaking alerts, all six monitors — is free with no signup and no trial clock. Pro pays for the feeds: it adds WM Analyst, the scenario engine, Route Explorer, scheduled digests and API access. No ads, and no account means there's no user data to sell.
What is a global intelligence dashboard?
A single live view that fuses signals most tools keep separate: conflict events, ship and aircraft tracking, shipping chokepoints, satellites, subsea cables, pipelines, markets and cyber threats — on one real-time world map, with AI scoring and briefs on top. World Monitor is a free one.
Where does the data come from?
65+ providers, named: ACLED and UCDP for conflict, AISStream for live vessels, OpenSky for aircraft, NASA FIRMS for fires, USGS for earthquakes, IMF, BIS, FRED and Finnhub for markets and macro — plus 500+ curated news feeds. Every panel cites its sources and timestamps inline.
Can I watch chokepoints like Hormuz or Bab el-Mandeb in real time?
Yes. 13 chokepoints are tracked with live AIS vessel counts, week-over-week transit change and disruption scoring — and density anomalies are flagged against each strait's rolling baseline.
How is this different from a conflict map like Liveuamap?
Conflict is one layer out of 56. World Monitor fuses conflicts with shipping, military flights, infrastructure, markets and cyber — then AI scores the convergence: instability indices, hotspot escalation, corroborated breaking alerts and daily briefs.
Why should I trust an alert?
A breaking banner fires only when independent origin types corroborate — news classification, keyword velocity, hotspot escalation, military surges, official sirens — deduplicated and rate-limited. Fewer alerts, real ones.
Can AI agents like Claude or GPT use it?
Yes. World Monitor ships a 39-tool MCP server, so Claude, GPT or any MCP-compatible agent can query live risk scores, chokepoint status, conflicts, markets and briefs — with JMESPath projection so agents fetch exactly what they need.
Do I need an account?
No. The dashboard works instantly with no signup. An account only matters when you upgrade to Pro or want settings synced across devices.
Is it open source?
Yes — open source under AGPL-3.0 on GitHub: read the code, self-host it, or build on it. Native desktop apps for Windows, macOS and Linux are available too, plus an Android TV app for wall displays.

The world map doesn't wait for you.

While you read this page it kept moving — 13 straits, 29 hotspots, 92 markets, 500+ feeds. One of them is tomorrow's front page. Find it first — free, no account.

Find it first
Free · No signup · Loads in seconds
Or see Pro plans →