Research · chokepoint-transit · v1.0.0
Strait of Hormuz Transit Report — July 2026
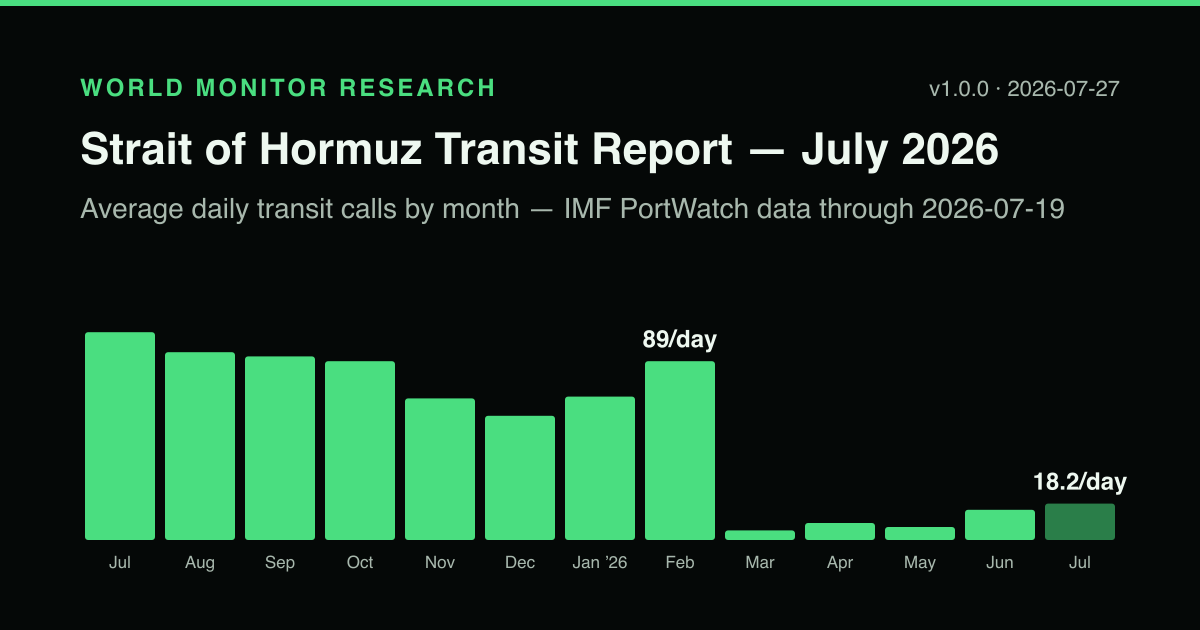
Strait of Hormuz transits are down 90.4% since the March 2026 closure — 9.9 ships/day since March 1 versus 103.2 in the same 2025 window — with July at about 20% of the February baseline, from IMF PortWatch daily data.
By World Monitor Research · published · modified · data through .
Derived analysis
Direct answer
Is the Strait of Hormuz open? Commercial transit has partially resumed but remains far below normal. Between 2026-03-01 and , IMF PortWatch recorded 1,400 vessel transits — a daily average of 9.9 against 103.2 in the same 2025 window, a 90.4% decline. July traffic to date averages 18.2 transits per day, about 20% of the February 2026 pre-disruption baseline.
This report quantifies the collapse and partial recovery using daily AIS-derived transit counts, keeps observed data separate from third-party event reporting, and documents exactly what this data cannot show — including vessels transiting with AIS transmitters off.
Derived analysis
Key figures
Observed transport data
What the observed data shows
Through February 2026, Hormuz transit levels were unremarkable: 89.4 transits per day in February against a 91.5 full-year 2025 average. The series breaks on 2026-03-01 (24 transits) and collapses from 2026-03-02, averaging 4.8 per day for March — including 2 days with zero AIS-observed transits. Across the full window since 2026-03-01 there have been 3 zero-transit days; the preceding seven years of the series contain none (the pre-collapse daily minimum was 19).
Recovery has been partial and uneven: 8.5 per day in April, 6.5 in May, 15.1 in June, and 18.2 for 2026-07-01 through . The strongest single day since the collapse was with 51 transits — still 43% below the February daily average. The final week of the observation window averaged 12.1 transits per day, lower than the preceding week, so the series gives no basis to describe the recovery as steadily improving.
Tanker traffic collapsed hardest. June 2026 averaged 5.7 tanker transits per day against 55.5 in June 2025, and aggregate transiting tanker capacity fell from 2.29 million DWT per day in February to 0.32 million in June.
| Month | Avg daily transits | Observed days |
|---|---|---|
| Jul 2025 | 103.9 | 31 |
| Aug 2025 | 93.9 | 31 |
| Sep 2025 | 91.8 | 30 |
| Oct 2025 | 89.4 | 31 |
| Nov 2025 | 70.8 | 30 |
| Dec 2025 | 62.1 | 31 |
| Jan 2026 | 71.7 | 31 |
| Feb 2026 | 89.4 | 28 |
| Mar 2026 | 4.8 | 31 |
| Apr 2026 | 8.5 | 30 |
| May 2026 | 6.5 | 31 |
| Jun 2026 | 15.1 | 30 |
| Jul 2026 (partial) | 18.2 | 19 |
Observed transport data
Other chokepoints in the same window
The Hormuz collapse is not visible in the neighbouring corridors. Bab el-Mandeb and Suez continue at the depressed levels that have persisted since the 2023–24 Red Sea crisis, and Cape of Good Hope diversion traffic remains elevated but flat. Any rerouting associated with the Hormuz disruption does not appear as a level change in these three series during this window.
| Chokepoint | 2025 avg | Feb 2026 | Jun 2026 | Jul 1–19 2026 |
|---|---|---|---|---|
| Bab el-Mandeb Strait | 33.2 | 36.4 | 36.2 | 35.4 |
| Suez Canal | 38.4 | 41.3 | 40.3 | 41.7 |
| Cape of Good Hope | 89.4 | 86.9 | 92.5 | 92.8 |
News context
Event context from named sources
World Monitor does not independently verify the events below; they are third-party reporting, listed with source and dates, and kept separate from the observed transit data above.
IMF PortWatch’s disruptions database lists event “HORMUZ-26” (alert level RED, event type “other”) affecting the Strait of Hormuz chokepoint, with a start date of 2026-03-01 and no end date.
Source: IMF PortWatch disruptions database (ArcGIS portwatch_disruptions_database) · source date 2026-03-01 · retrieved 2026-07-27.
CSIS reports the disruption began on 2026-03-02 following U.S. and Israeli strikes on Iran, that Iran declared the strait open on 2026-04-17 with the IRGC reversing course on 2026-04-18, and that the strait carries roughly a quarter of global oil flows.
Source: CSIS, “The Strait of Hormuz in 8 Charts” (published 2026-04-22) · source date 2026-04-22 · retrieved 2026-07-27.
The independent tracker straits.live counted 99 tankers “running dark” (transmitting no AIS) in the region and cautions that AIS-based transit counts may understate true flow.
Source: straits.live independent Hormuz tracker · source date 2026-07-27 · retrieved 2026-07-27.
Methodology
Methodology
All transit figures derive from one source: IMF PortWatch daily chokepoint transit calls (portwatch.imf.org, based on UN Global Platform AIS data), retrieved on from the public PortWatch ArcGIS service and frozen into the versioned snapshot named below. A transit call is an AIS-observed passage; vessel classes (tanker, container, dry bulk, general cargo, ro-ro) and deadweight-tonnage aggregates are PortWatch fields, not World Monitor estimates.
Derived figures are arithmetic over that series only — period averages, sums, and percentage comparisons, each documented in the provenance table below. No smoothing, interpolation, forecasting, or cross-source blending is applied. Missing days would be listed explicitly rather than filled; this snapshot has 0 missing days across all four series. The report page is rebuilt deterministically from the committed snapshot, so every figure can be recomputed from the published data files.
Methodology
Limitations and known gaps
AIS undercount: PortWatch counts AIS-broadcasting passages. In a conflict zone with GPS interference and deliberate transponder shutdowns, physical transits can exceed AIS-observed transits by an unknown margin; an independent tracker counted 99 tankers in the region transmitting no AIS on 2026-07-27. The published counts are therefore a lower bound on total transit activity, not a measurement of total physical flow.
Publication lag: the PortWatch series ended at when retrieved on — an eight-day lag. This report does not estimate the missing days. Upstream revisions: PortWatch may revise history; this edition is pinned to its retrieval snapshot and states its retrieval time precisely so revisions are detectable.
July 2026 figures cover 2026-07-01 through only and are labelled partial wherever they appear. Official statements and market context are out of scope for this edition, as declared above.
Machine-readable data
Download the data
- strait-of-hormuz-transit-report-2026-07.csv — the focus-chokepoint daily series, 2757 rows (2019-01-01 → 2026-07-19), one row per day, columns documented in the JSON schema below.
- strait-of-hormuz-transit-report-2026-07.json — all four chokepoint series plus every published figure with its observation period, method, provenance, units, CSV schema, licensing/attribution notes, and version identifier.
Both files are versioned (report version 1.0.0, snapshot chokepoint-transit-2026-07) and regenerate byte-identically from the committed snapshot. Underlying data: IMF PortWatch; cite it when reusing the raw series.
Methodology
Figure provenance
Every figure in this report, with its observation period, transformation, and source. Recompute any of them from the downloadable data.
| Figure | Value | Observation period | Method |
|---|---|---|---|
| February 2026 daily average | 89.4 transits/day | 2026-02-01 → 2026-02-28 | mean of daily total transit calls |
| February 2026 tanker daily average | 49.4 transits/day | 2026-02-01 → 2026-02-28 | mean of daily tanker transit calls |
| 2025 full-year daily average | 91.5 transits/day | 2025-01-01 → 2025-12-31 | mean of daily total transit calls |
| March 2026 daily average | 4.8 transits/day | 2026-03-01 → 2026-03-31 | mean of daily total transit calls |
| April 2026 daily average | 8.5 transits/day | 2026-04-01 → 2026-04-30 | mean of daily total transit calls |
| May 2026 daily average | 6.5 transits/day | 2026-05-01 → 2026-05-31 | mean of daily total transit calls |
| June 2026 daily average | 15.1 transits/day | 2026-06-01 → 2026-06-30 | mean of daily total transit calls |
| June 2026 tanker daily average | 5.7 transits/day | 2026-06-01 → 2026-06-30 | mean of daily tanker transit calls |
| June 2025 tanker daily average | 55.5 transits/day | 2025-06-01 → 2025-06-30 | mean of daily tanker transit calls |
| July 2026 daily average (partial month) | 18.2 transits/day | 2026-07-01 → 2026-07-19 | mean of daily total transit calls |
| Transits on 2026-03-01 | 24 transits | 2026-03-01 | daily total transit calls |
| Days in disruption window | 141 days | 2026-03-01 → 2026-07-19 | count of observed days |
| Total transits since 2026-03-01 | 1,400 transits | 2026-03-01 → 2026-07-19 | sum of daily total transit calls |
| Daily average since 2026-03-01 | 9.9 transits/day | 2026-03-01 → 2026-07-19 | sum of daily totals ÷ observed days |
| Total transits, same 2025 window | 14,547 transits | 2025-03-01 → 2025-07-19 | sum of daily total transit calls |
| Daily average, same 2025 window | 103.2 transits/day | 2025-03-01 → 2025-07-19 | sum of daily totals ÷ observed days |
| Transit decline vs same 2025 window | 90.4% | 2026-03-01 → 2026-07-19 vs 2025 equivalent | 1 − (2026 window sum ÷ 2025 window sum) |
| July 2026 (partial) as share of February 2026 | 20% | 2026-07-01 → 2026-07-19 vs 2026-02 | July partial-month daily average ÷ February daily average |
| Zero-transit days in March 2026 | 2 days | 2026-03-01 → 2026-03-31 | count of days with total = 0 |
| Zero-transit days since 2026-03-01 | 3 days | 2026-03-01 → 2026-07-19 | count of days with total = 0 |
| Pre-collapse daily minimum (2019 → February 2026) | 19 transits | 2019-01-01 → 2026-02-28 | minimum daily total transit calls |
| Strongest day since the collapse | 2026-06-24 | 2026-03-01 → 2026-07-19 | date of maximum daily total |
| Transits on the strongest post-collapse day | 51 transits | 2026-06-24 | daily total transit calls |
| Strongest post-collapse day vs February average | 43% | 2026-06-24 vs 2026-02 | 1 − (peak daily total ÷ February daily average) |
| Final observed week daily average | 12.1 transits/day | 2026-07-13 → 2026-07-19 | mean of daily total transit calls |
| February 2026 tanker capacity | 2.29 million DWT/day | 2026-02-01 → 2026-02-28 | mean of daily aggregate tanker deadweight tonnage ÷ 10⁶ |
| June 2026 tanker capacity | 0.32 million DWT/day | 2026-06-01 → 2026-06-30 | mean of daily aggregate tanker deadweight tonnage ÷ 10⁶ |
| Observation window end | 2026-07-19 | 2026-07-19 | latest date in the retrieved series |
| Snapshot retrieval date | 2026-07-27 | 2026-07-27 | UTC date of the snapshot retrieval |
| Missing days across all series | 0 days | 2019-01-01 → 2026-07-19 | sum of enumerated calendar gaps across snapshot series |
Methodology
Cite this report
Cite the report as:
World Monitor Research, “Strait of Hormuz Transit Report — July 2026”, version 1.0.0, published 2026-07-27. https://www.worldmonitor.app/research/strait-of-hormuz-transit-report-2026-07/ — underlying transit data: IMF PortWatch (portwatch.imf.org).
The canonical URL is stable, editions are append-only, and corrections bump the version and modified date rather than silently rewriting figures.
Live product
Track this live
This report is a dated snapshot. For the current picture: the live Strait of Hormuz status page shows today's disruption pulse, and the World Monitor dashboard adds map layers, alerts, and vessel context around it.
Programmatic access: the same chokepoint status and transit history are available through the World Monitor REST API and the MCP server for AI agents. Higher request limits and research briefings come with World Monitor Pro. The research itself stays free and ungated.
Declared gaps
What this edition does not cover
- Official statements: Primary-source government and IRGC statements are not independently collected in this edition; the timeline relies on the named third-party reporting below.
- Market context: Freight rates, war-risk insurance premia, and energy prices are not collected in this edition. No market claim in this report should be inferred from transit counts alone.
Why this report exists
Topic selection, from evidence
- Topic selected after a 2026-07-26 spot check found no authoritative public source for daily Strait of Hormuz transit counts — the exact reviewed query q07 in the visibility baseline (use-case intent, chokepoints page family, IMF PortWatch as named source).
- The 2026-07-27 visibility baseline shows the category query already earning AI citations (4/4 platform mentions, 3/4 direct) while use-case queries have no observed visibility, so the next authority asset belongs on a use-case surface.
- The baseline’s expansion gate allows at most one evidence-rich report experiment before credentialed demand data arrives; this pilot is that single experiment.
Snapshot: docs/snapshots/chokepoint-transit-2026-07.json (retrieved 2026-07-27T21:38:37.469Z). Attribution: IMF PortWatch (portwatch.imf.org), based on UN Global Platform AIS data. Consult portwatch.imf.org for upstream terms of use. Methodology: chokepoint monitoring methodology.