
worldmonitor npm package next to the command-line client, needs no API key, and shows the same live data as the web dashboard: a world map, ranked news, markets, conflict and instability, military flights and shipping, cyber threats, climate hazards, prediction markets, live TV and webcams, and platform health.
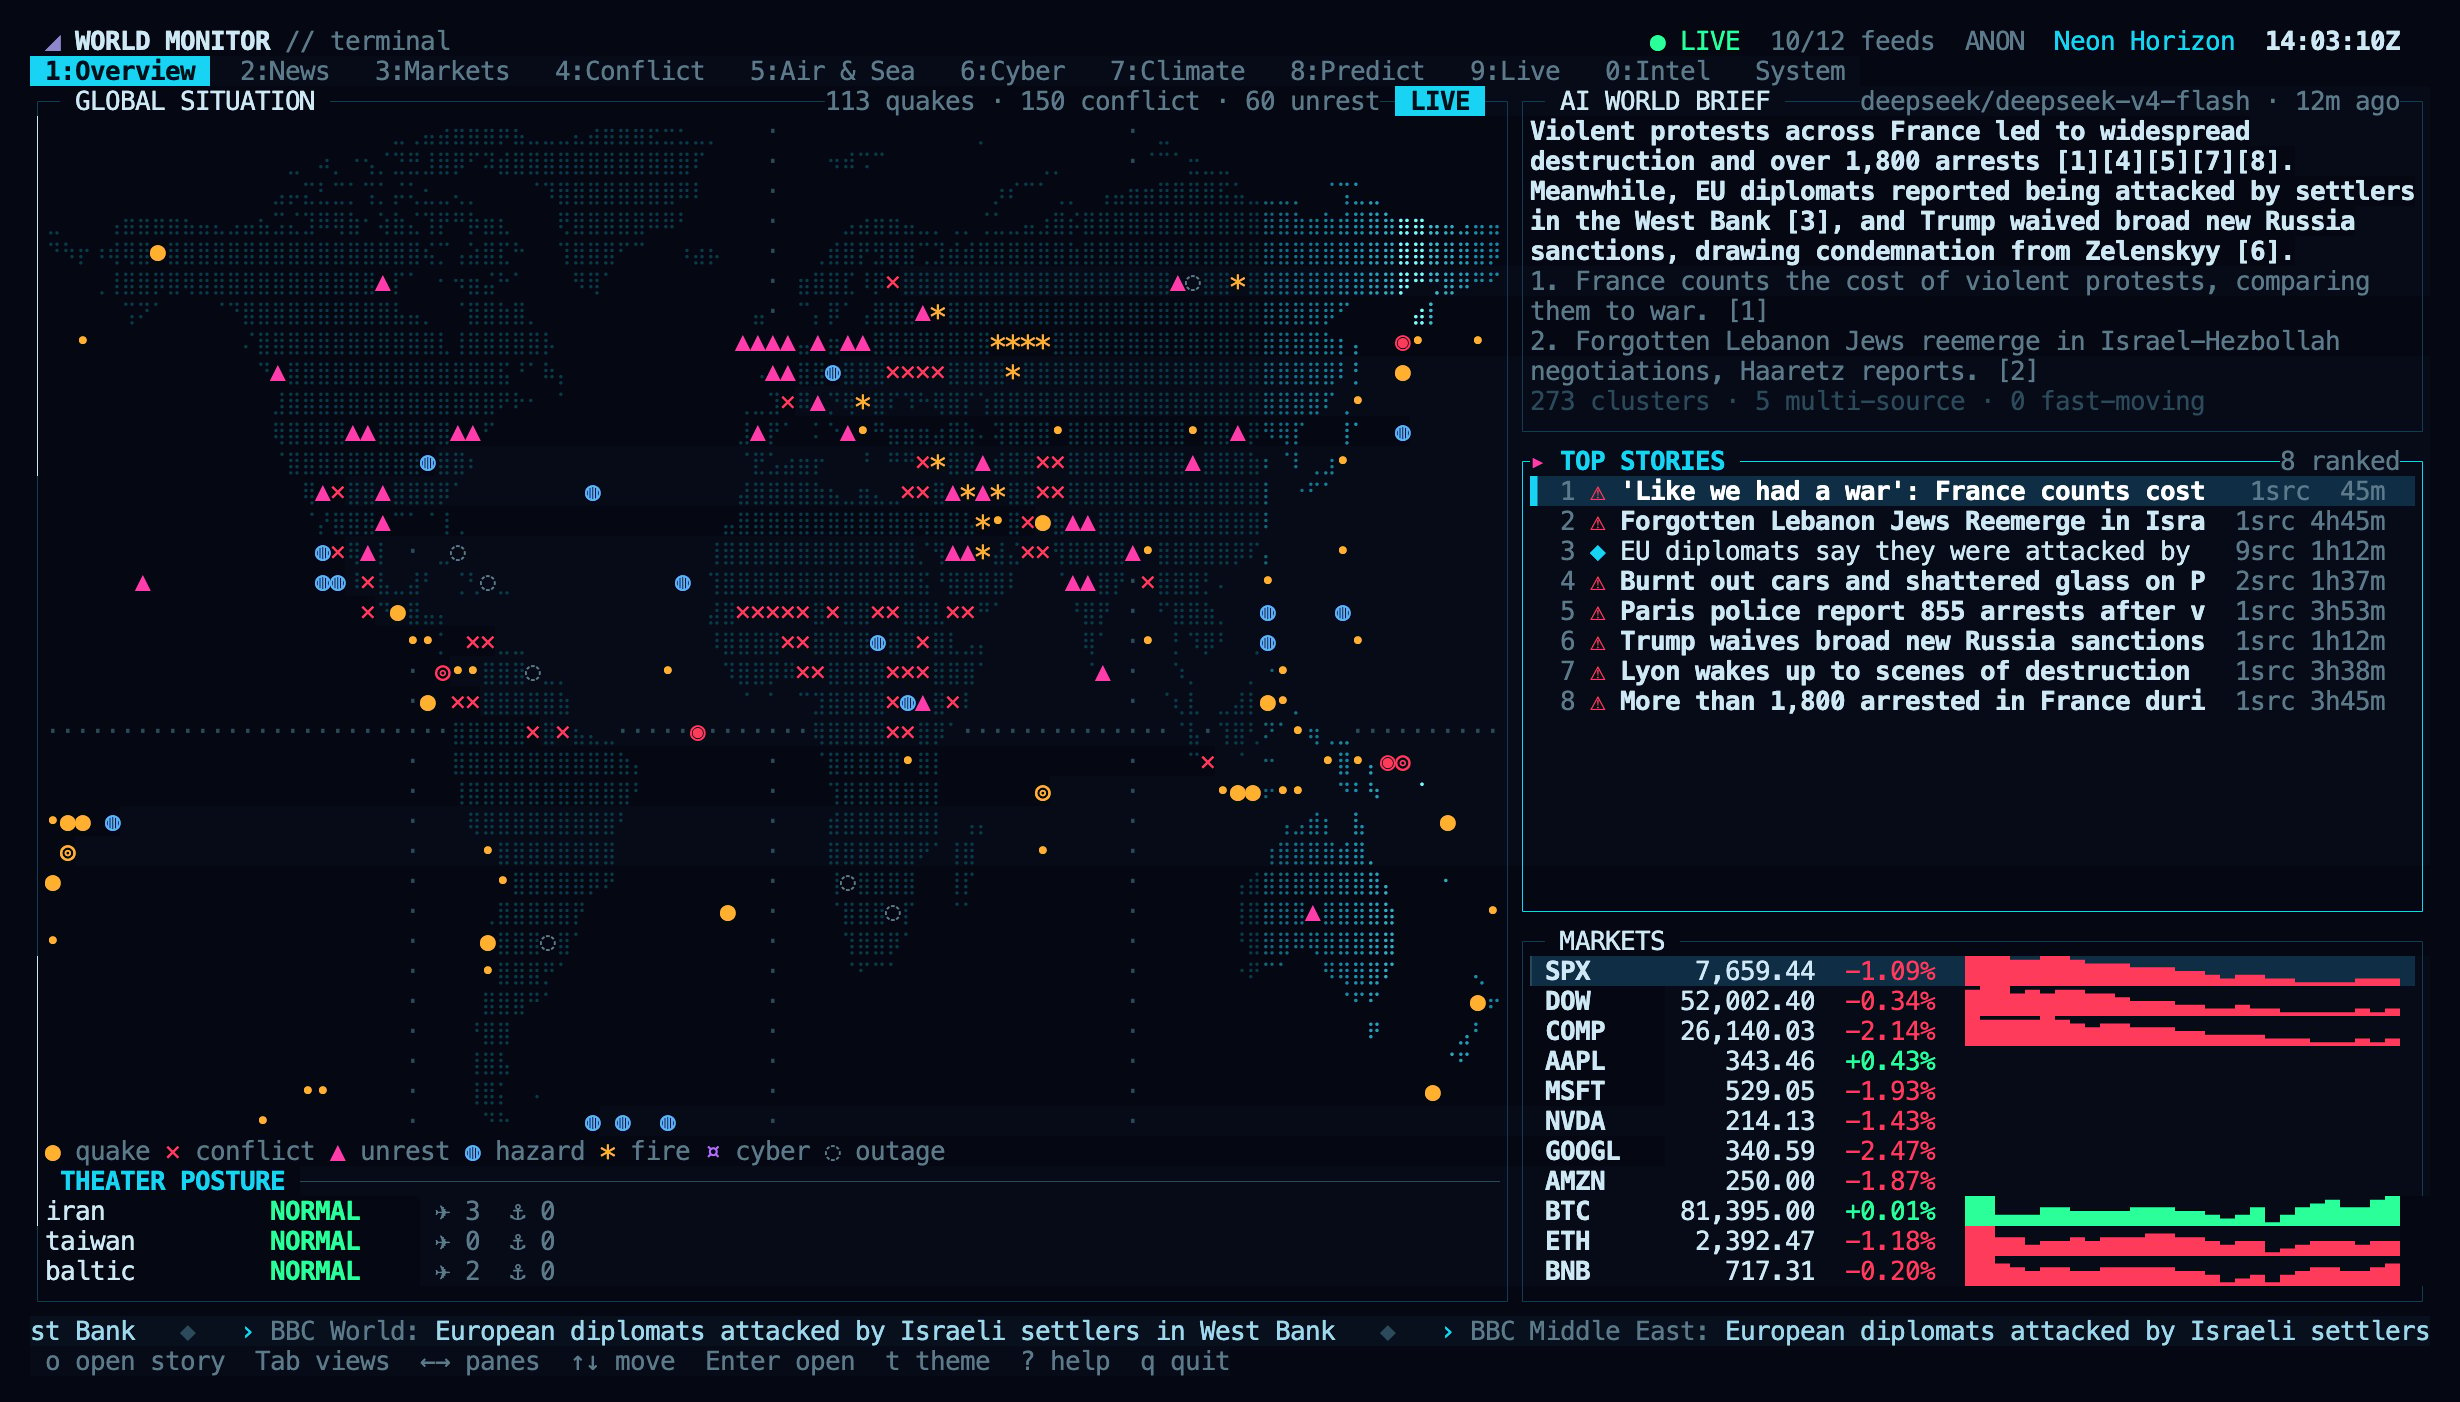
Overview: the live world map with quakes, conflict, unrest, hazards, fires, cyber and outage markers, the AI world brief, ranked top stories, a market strip and theater posture.
Start it
worldmonitor with no arguments in an interactive terminal opens the dashboard. In a pipe, a script or CI it prints the help text instead, so existing automation is unaffected. Press q to quit; the terminal is restored as it was.
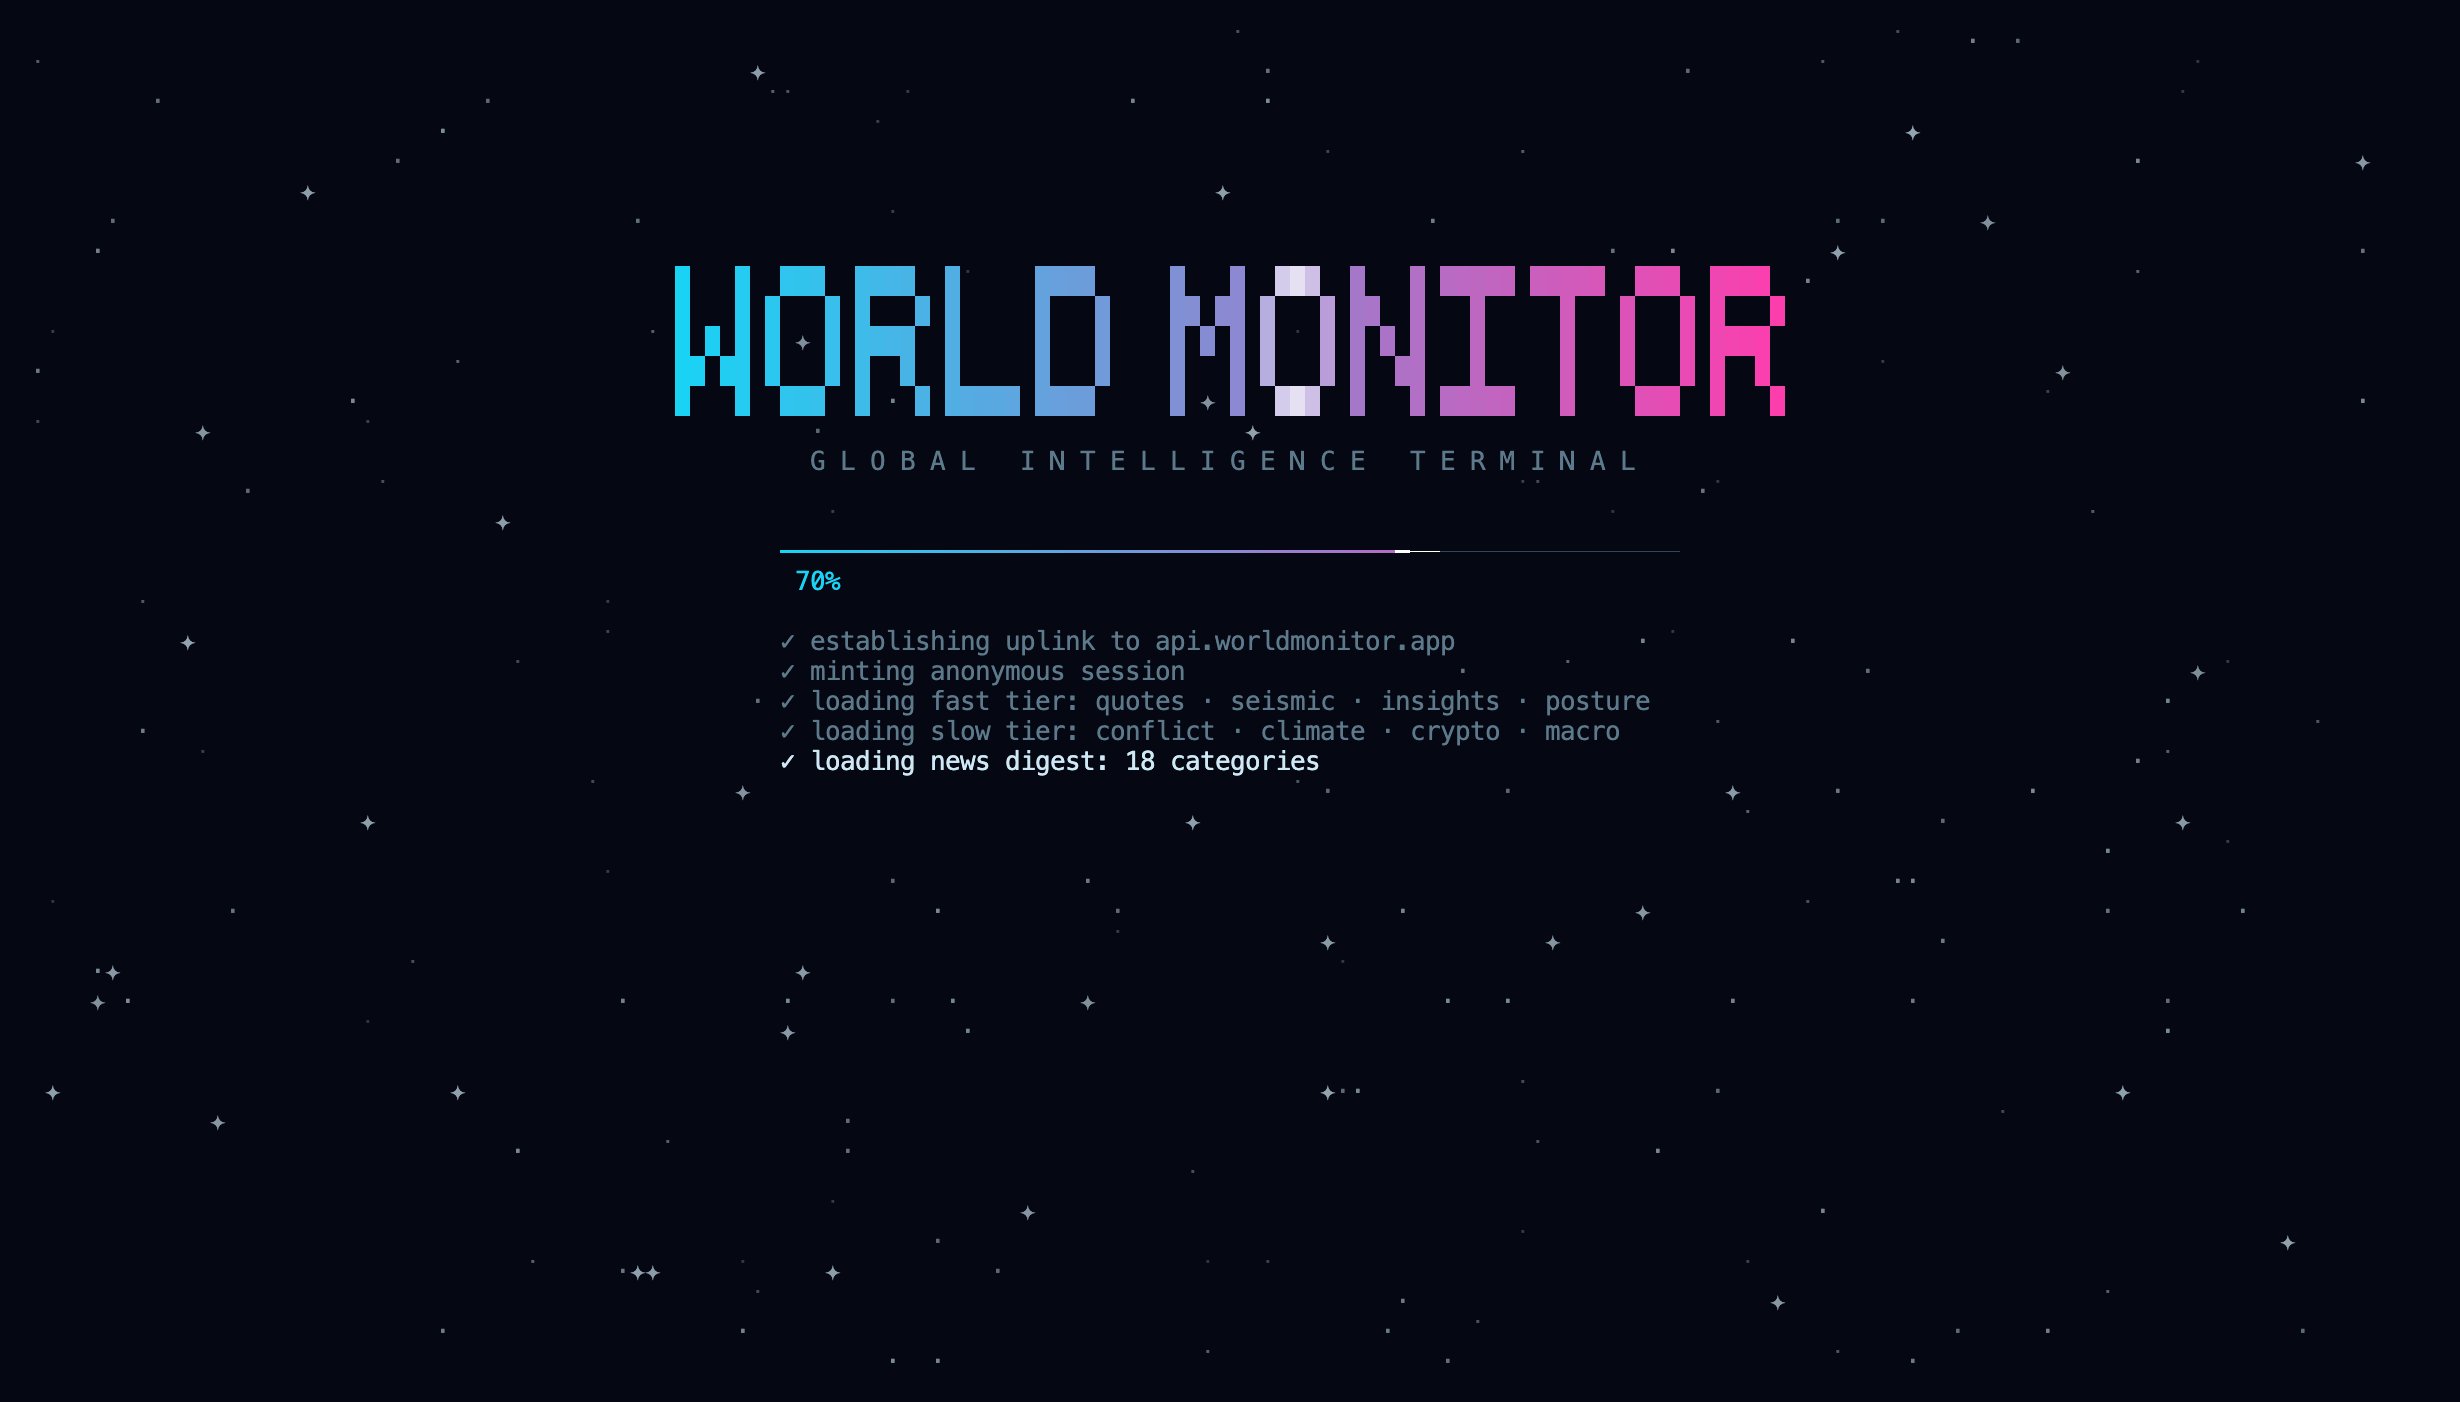
Startup: the dashboard connects to the API and loads each data tier before the first view appears. Press Esc, Enter or Space to skip it.
Requirements
- Node.js 18 or newer. The package has no dependencies.
- An interactive terminal of at least 80×24. Larger windows show more panes side by side; 160×45 or more gives the full layout shown on this page.
- A terminal with truecolor and mouse support for the best result, such as Ghostty, kitty, WezTerm, iTerm2, Konsole, Alacritty or the VS Code terminal. Terminals that do not report truecolor, including macOS Terminal, get 256 colours.
- A font with braille and box-drawing characters for the map and panel borders. Most current terminal fonts include them.
- Optional: mpv and yt-dlp to play live TV and webcams in the terminal. Without them, streams open in your browser.
Views
Switch views with the number keys,Tab / Shift+Tab, or by clicking a tab.
News
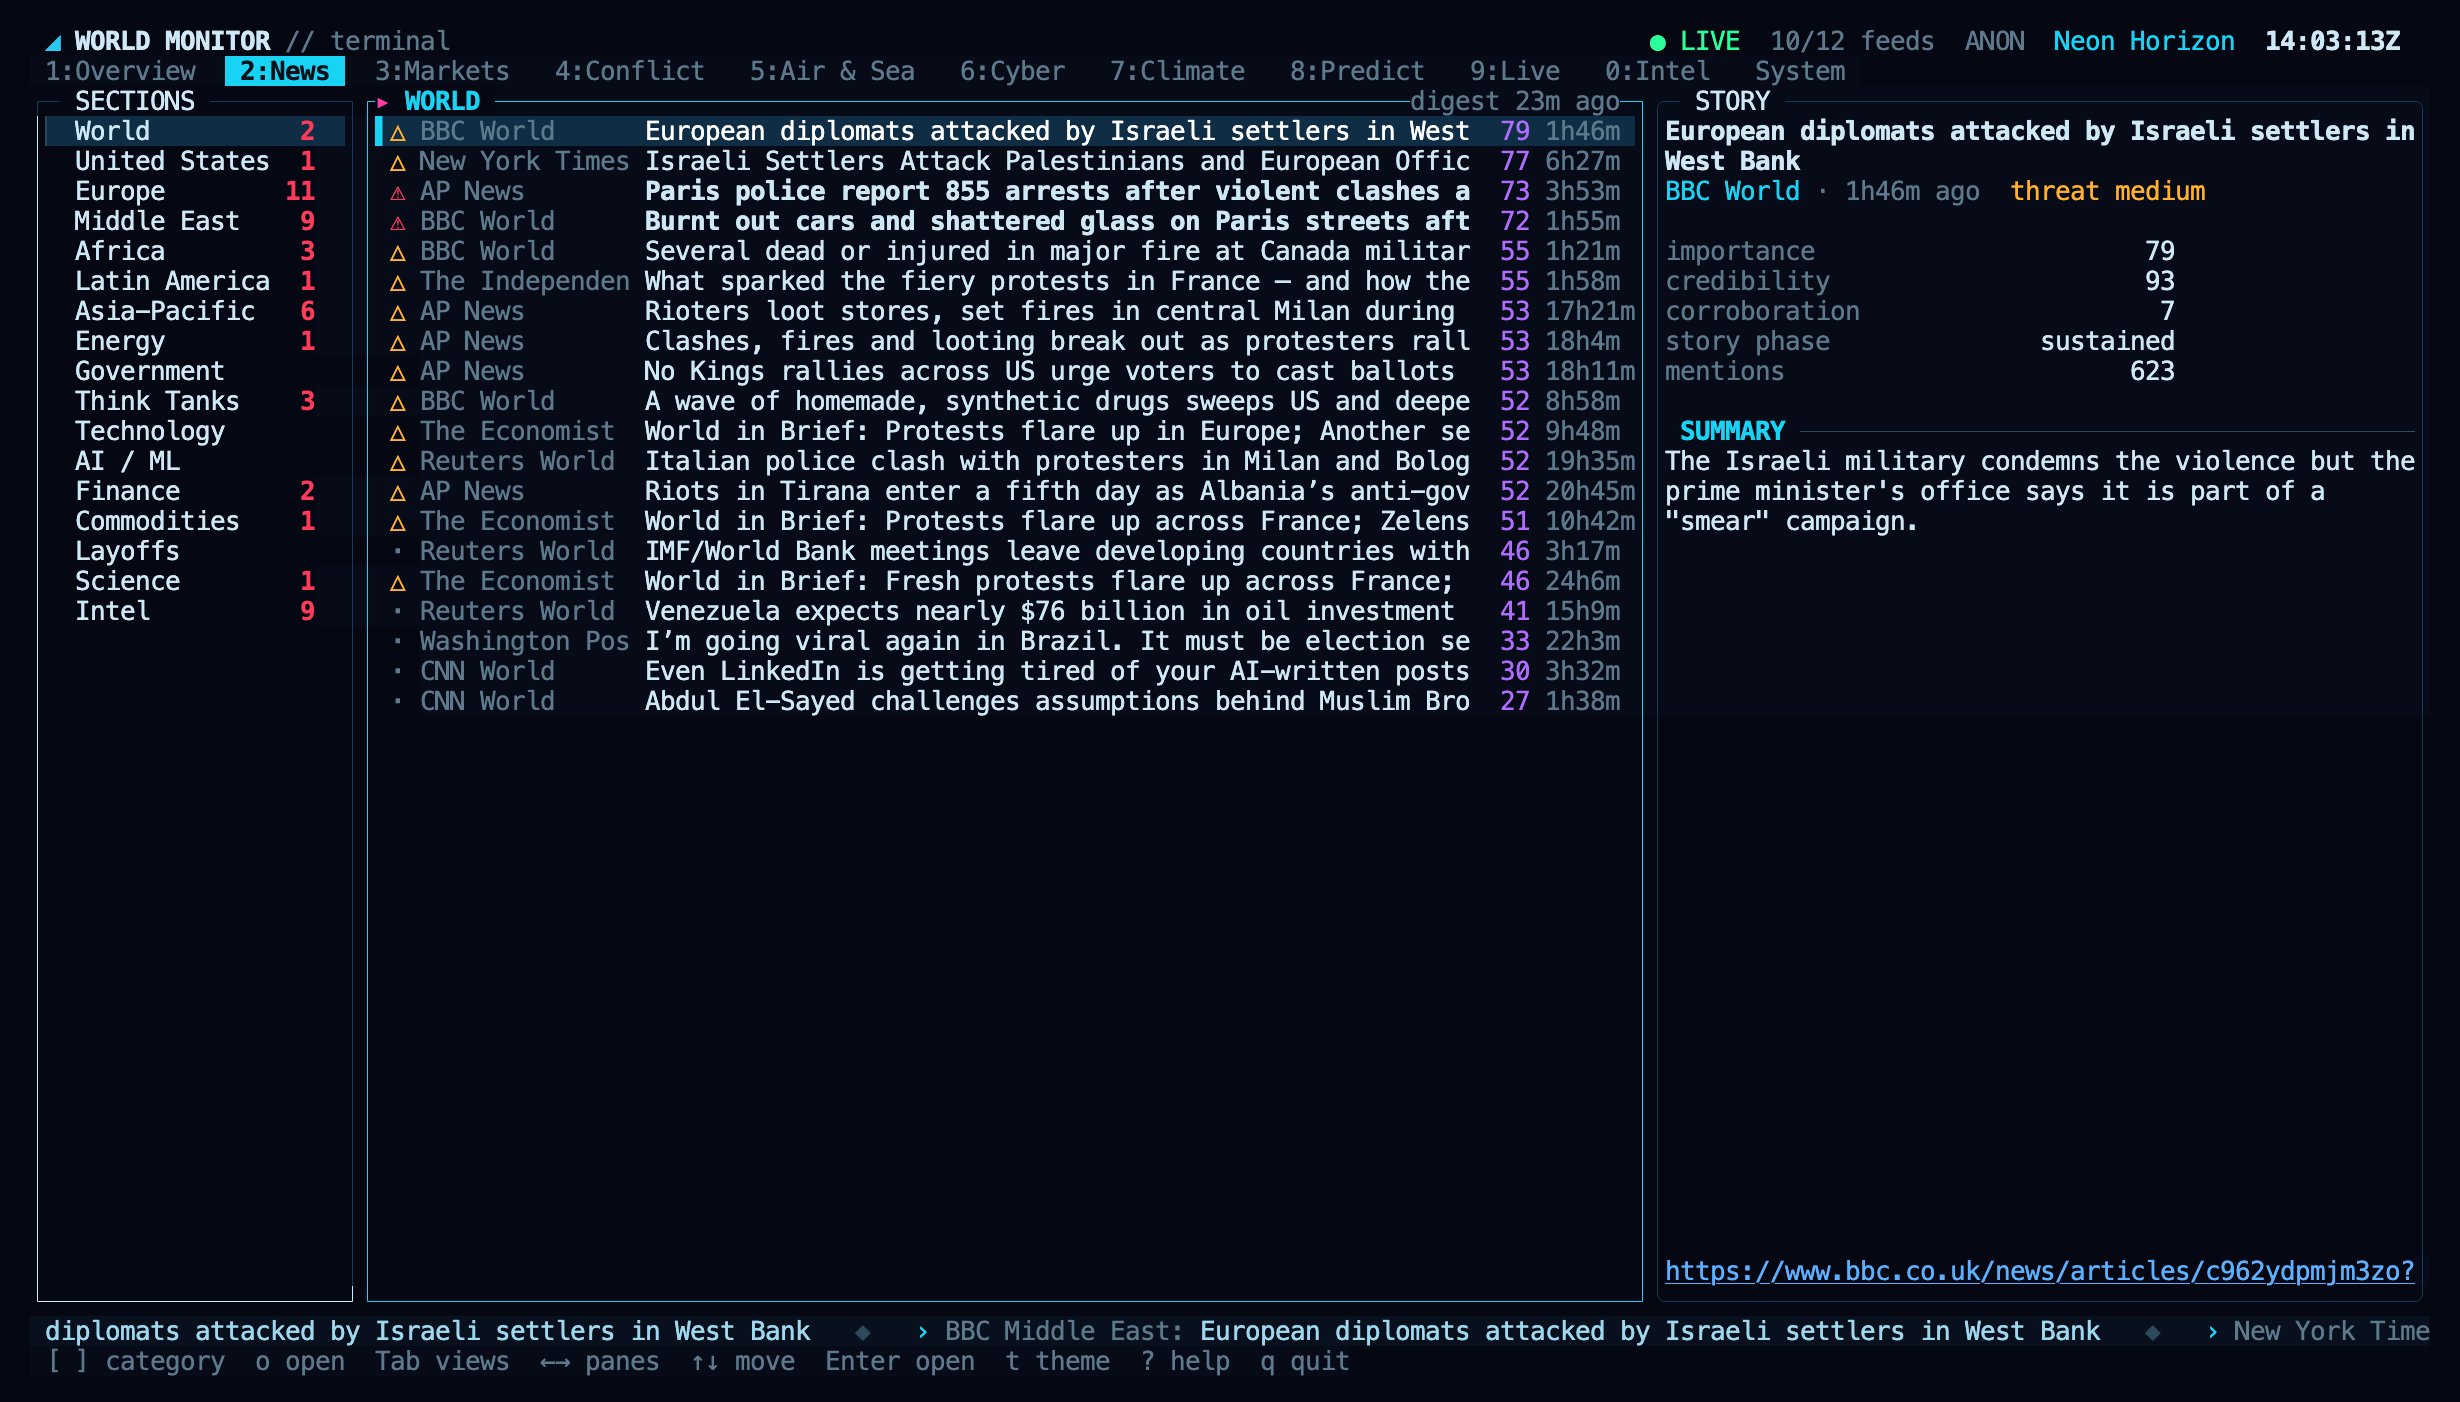
News: digest sections on the left, ranked headlines with source, importance score and age in the middle, and the selected story's scores, summary and link on the right.
[ and ] change the section. Enter or o opens the selected story in your browser.
Markets
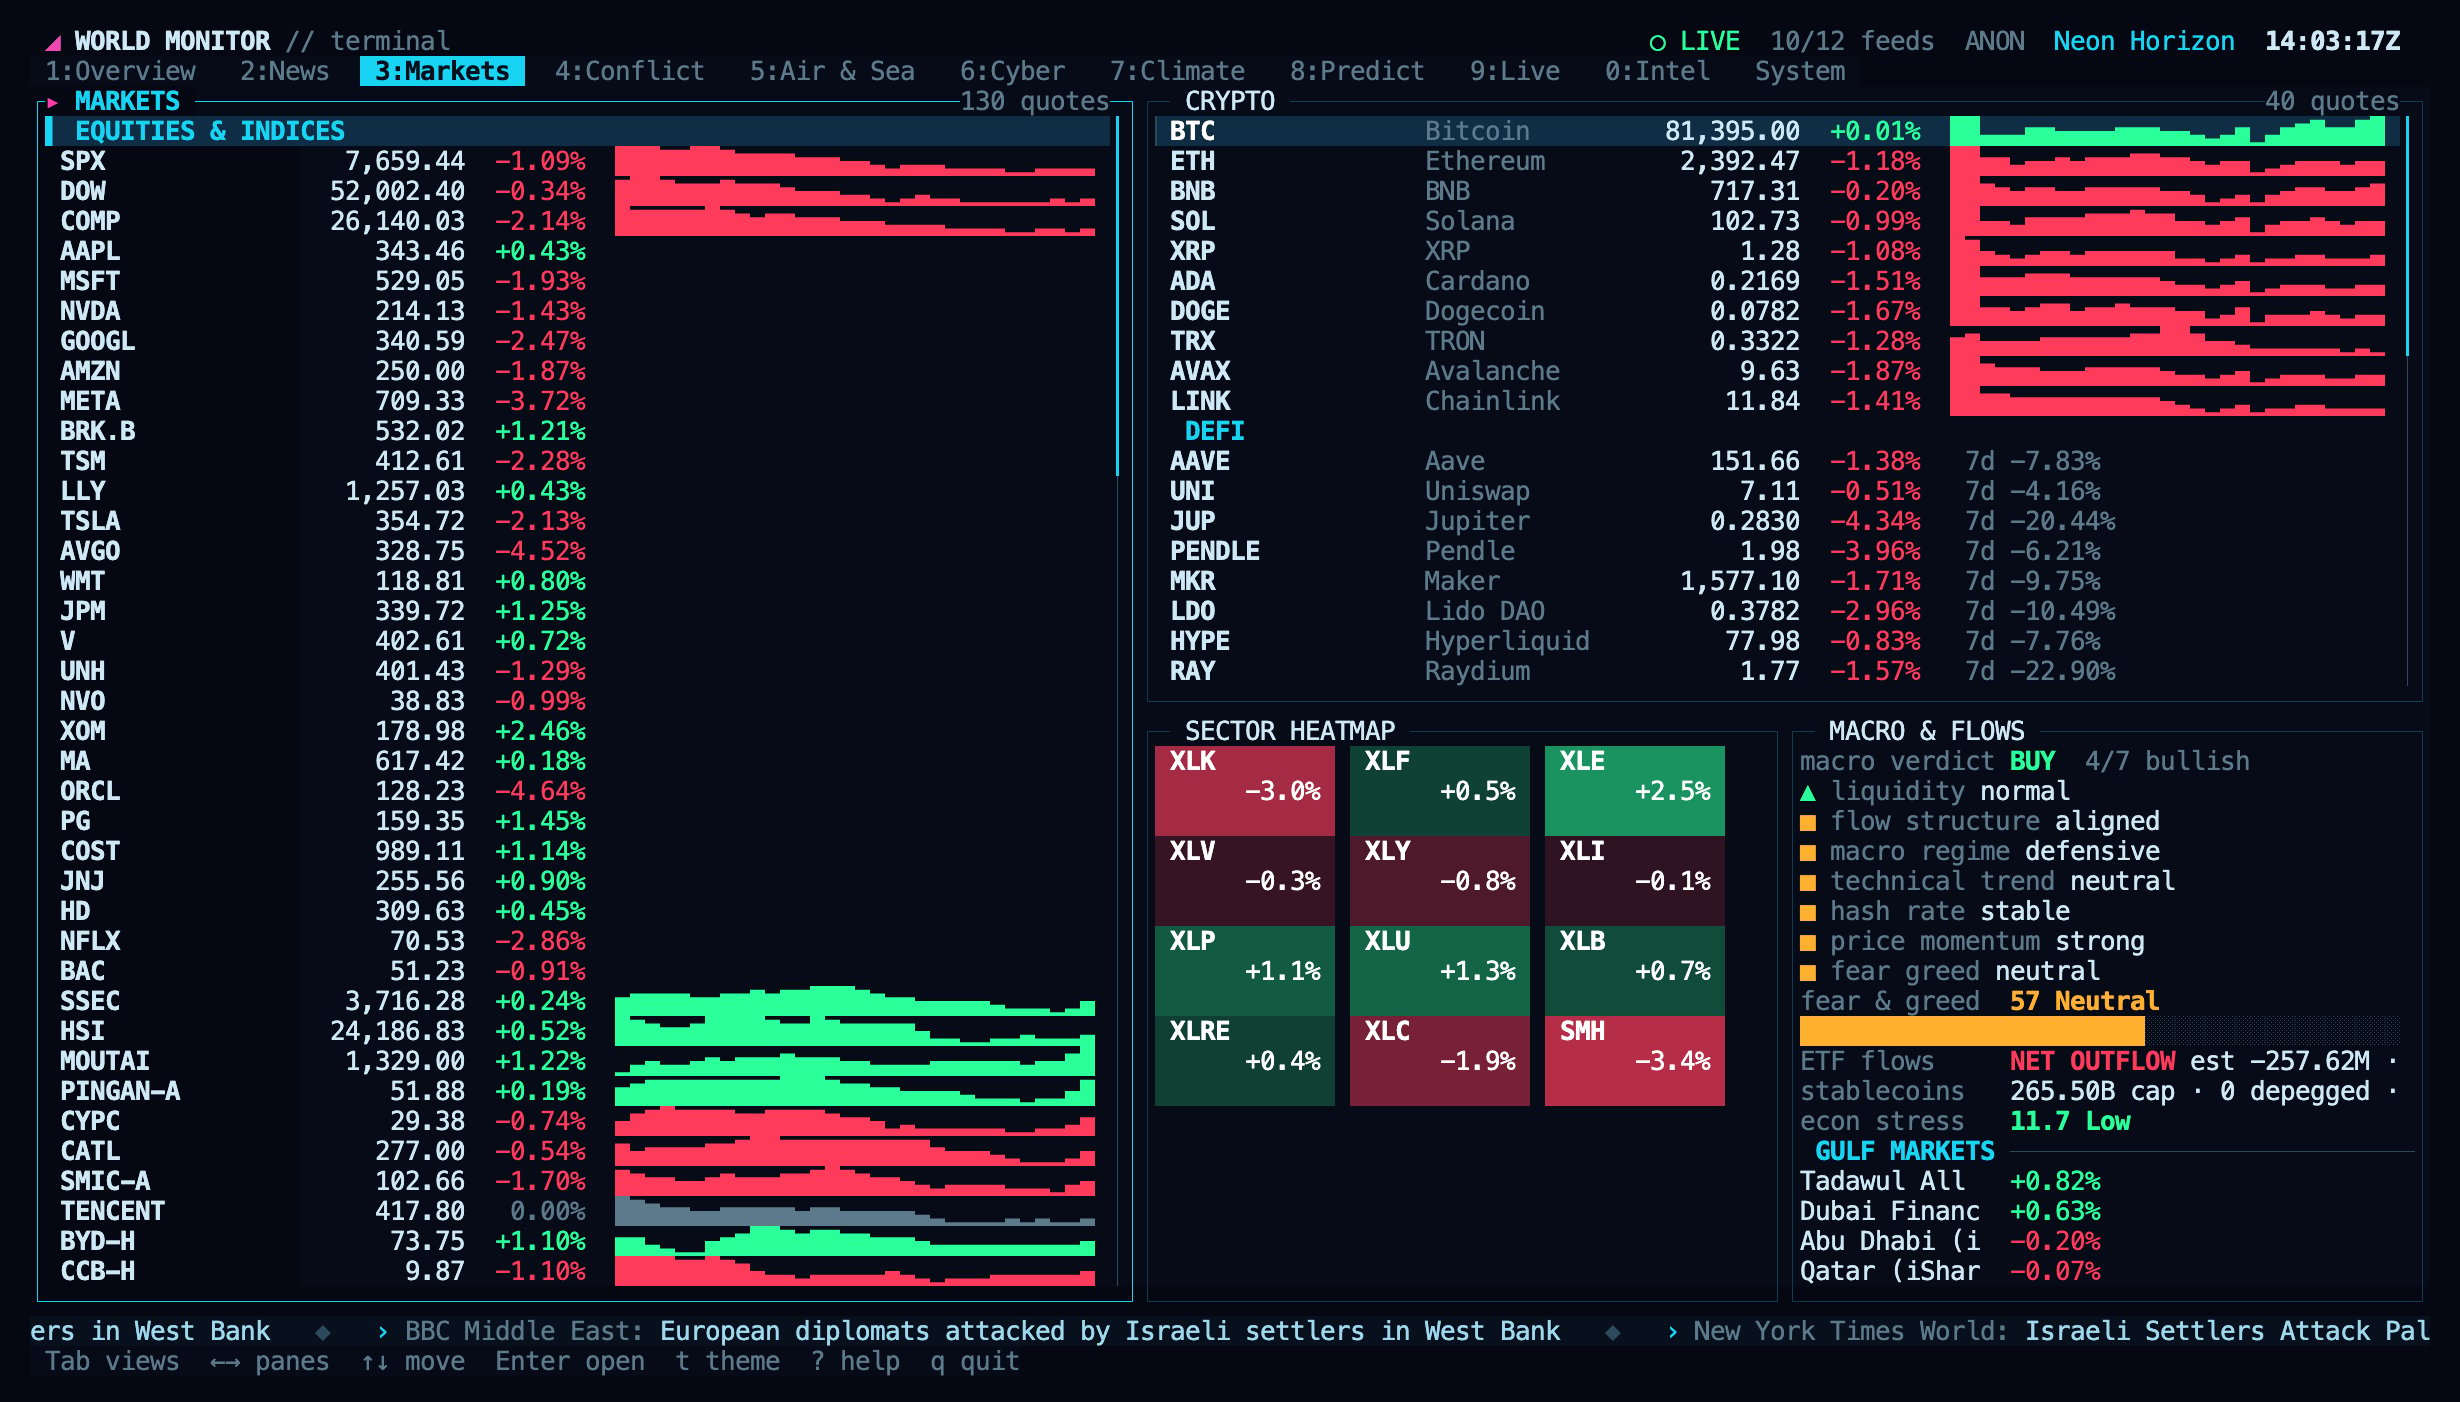
Markets: quotes with sparklines, crypto, a sector heatmap, macro signals, fear & greed and ETF flows.
Conflict
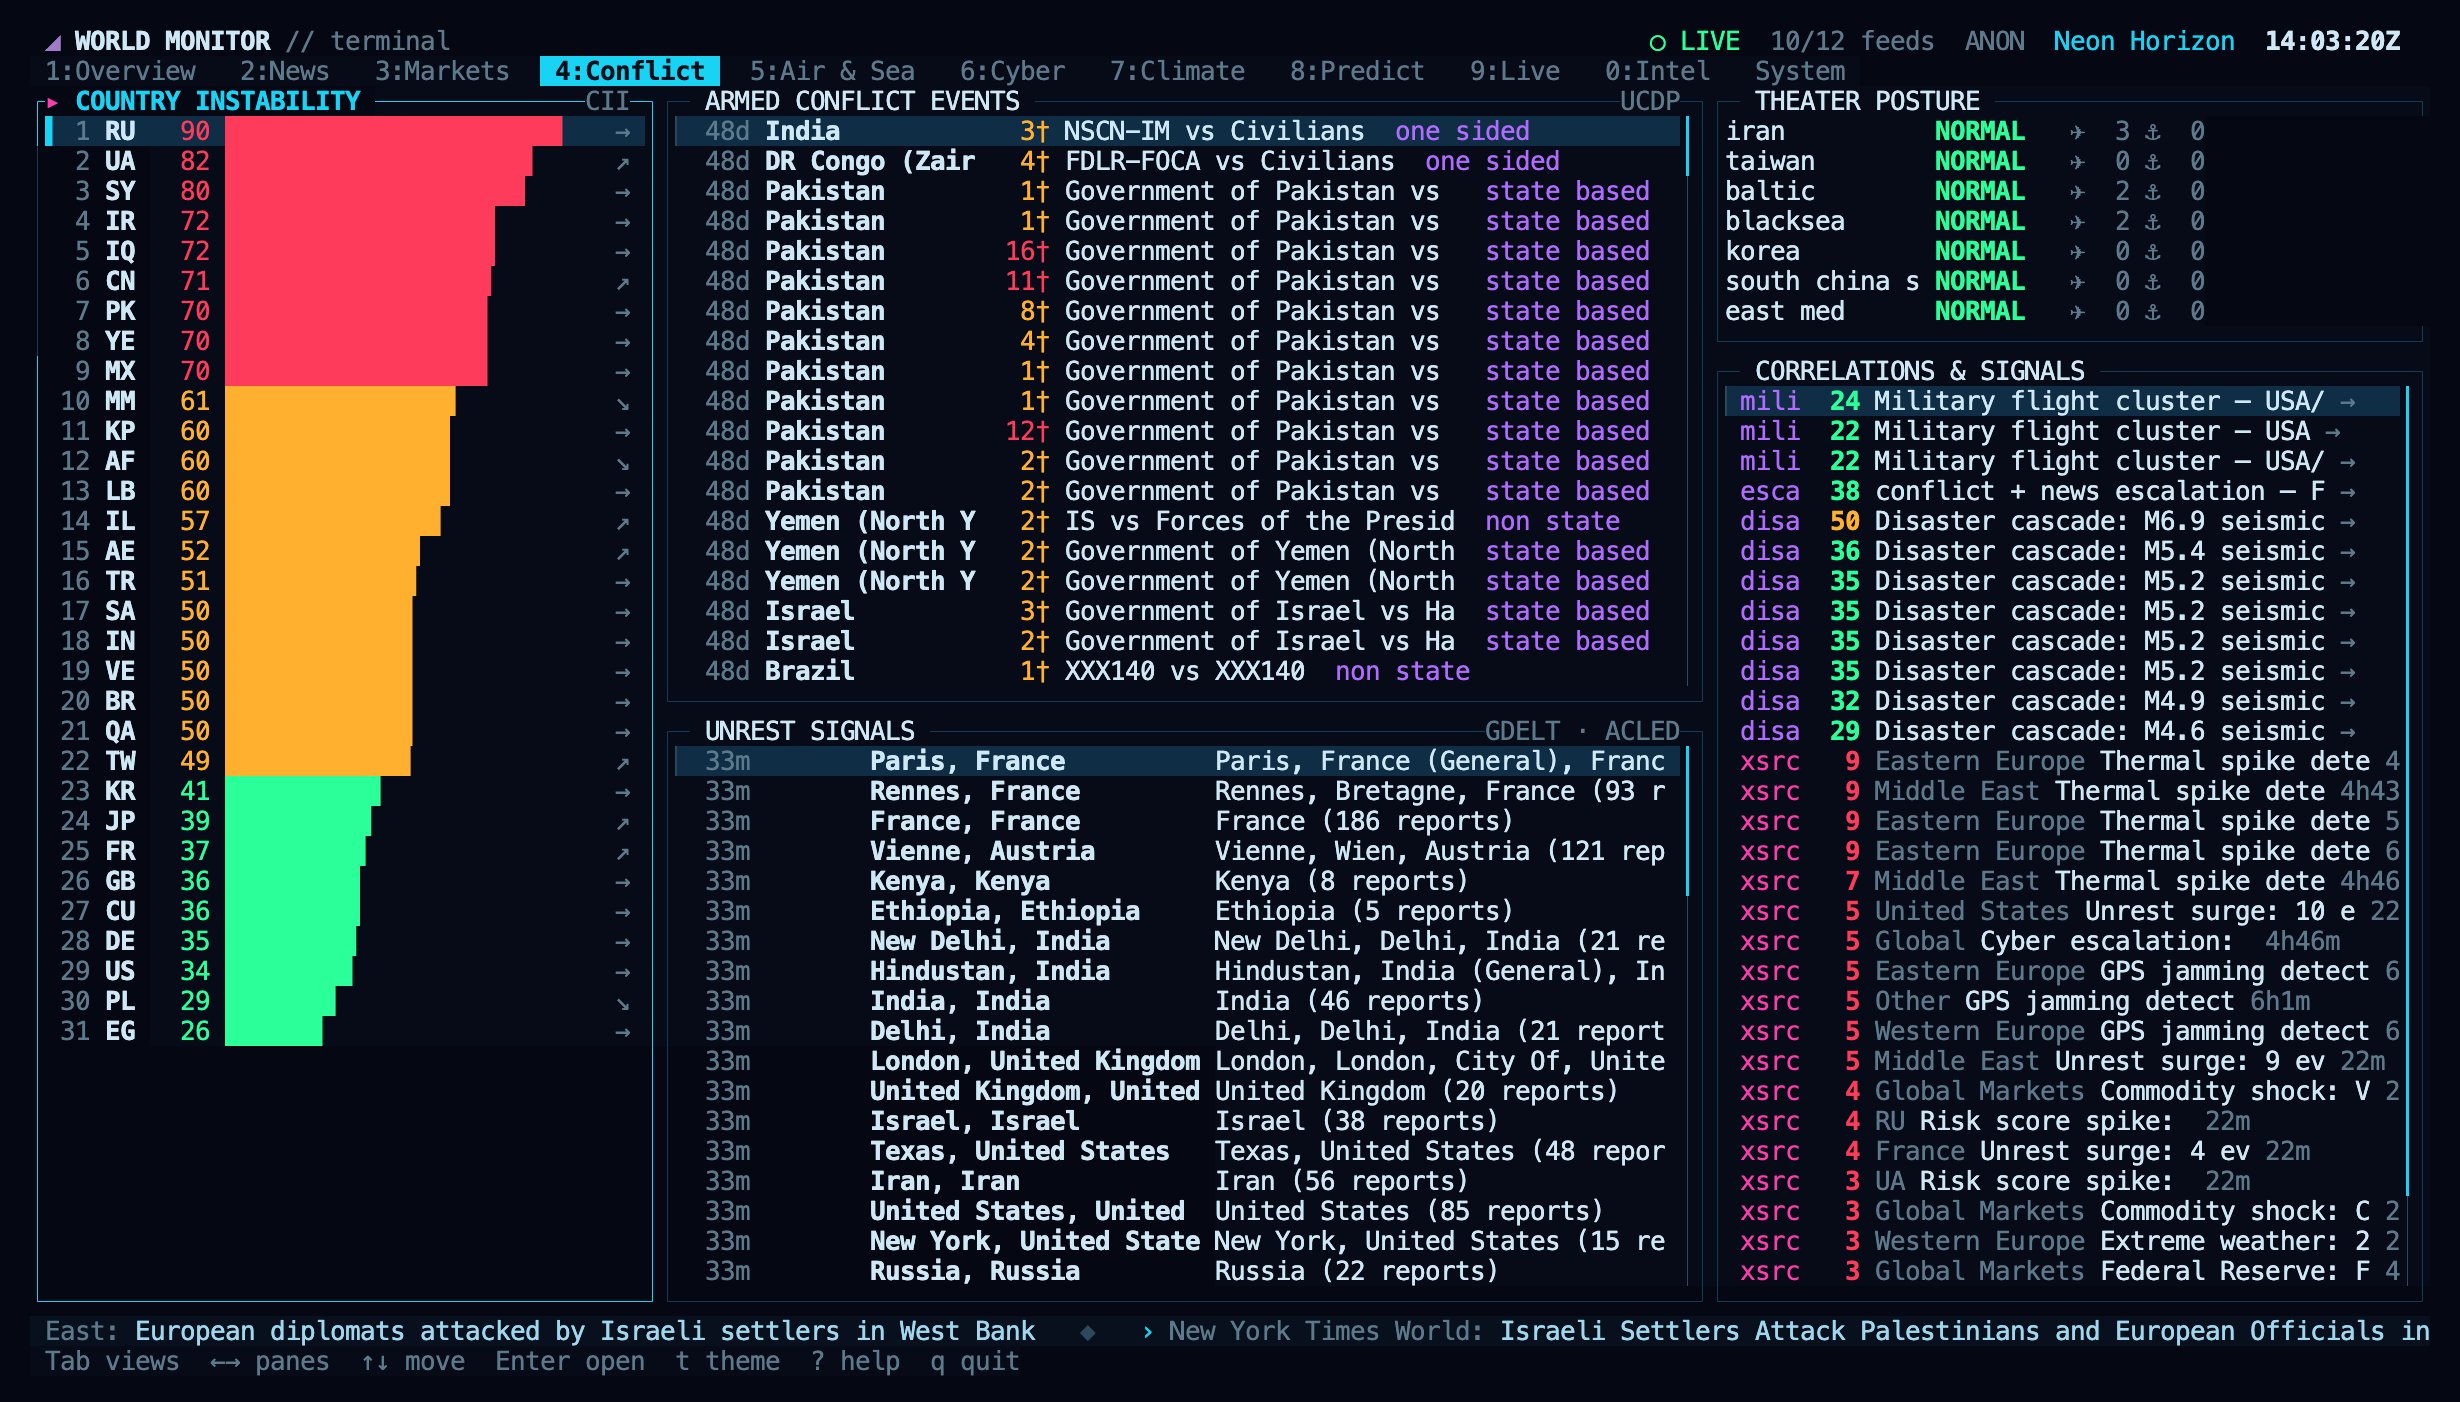
Conflict: the Country Instability Index ranking, recent UCDP armed-conflict events, unrest signals and correlation cards.
Air & Sea
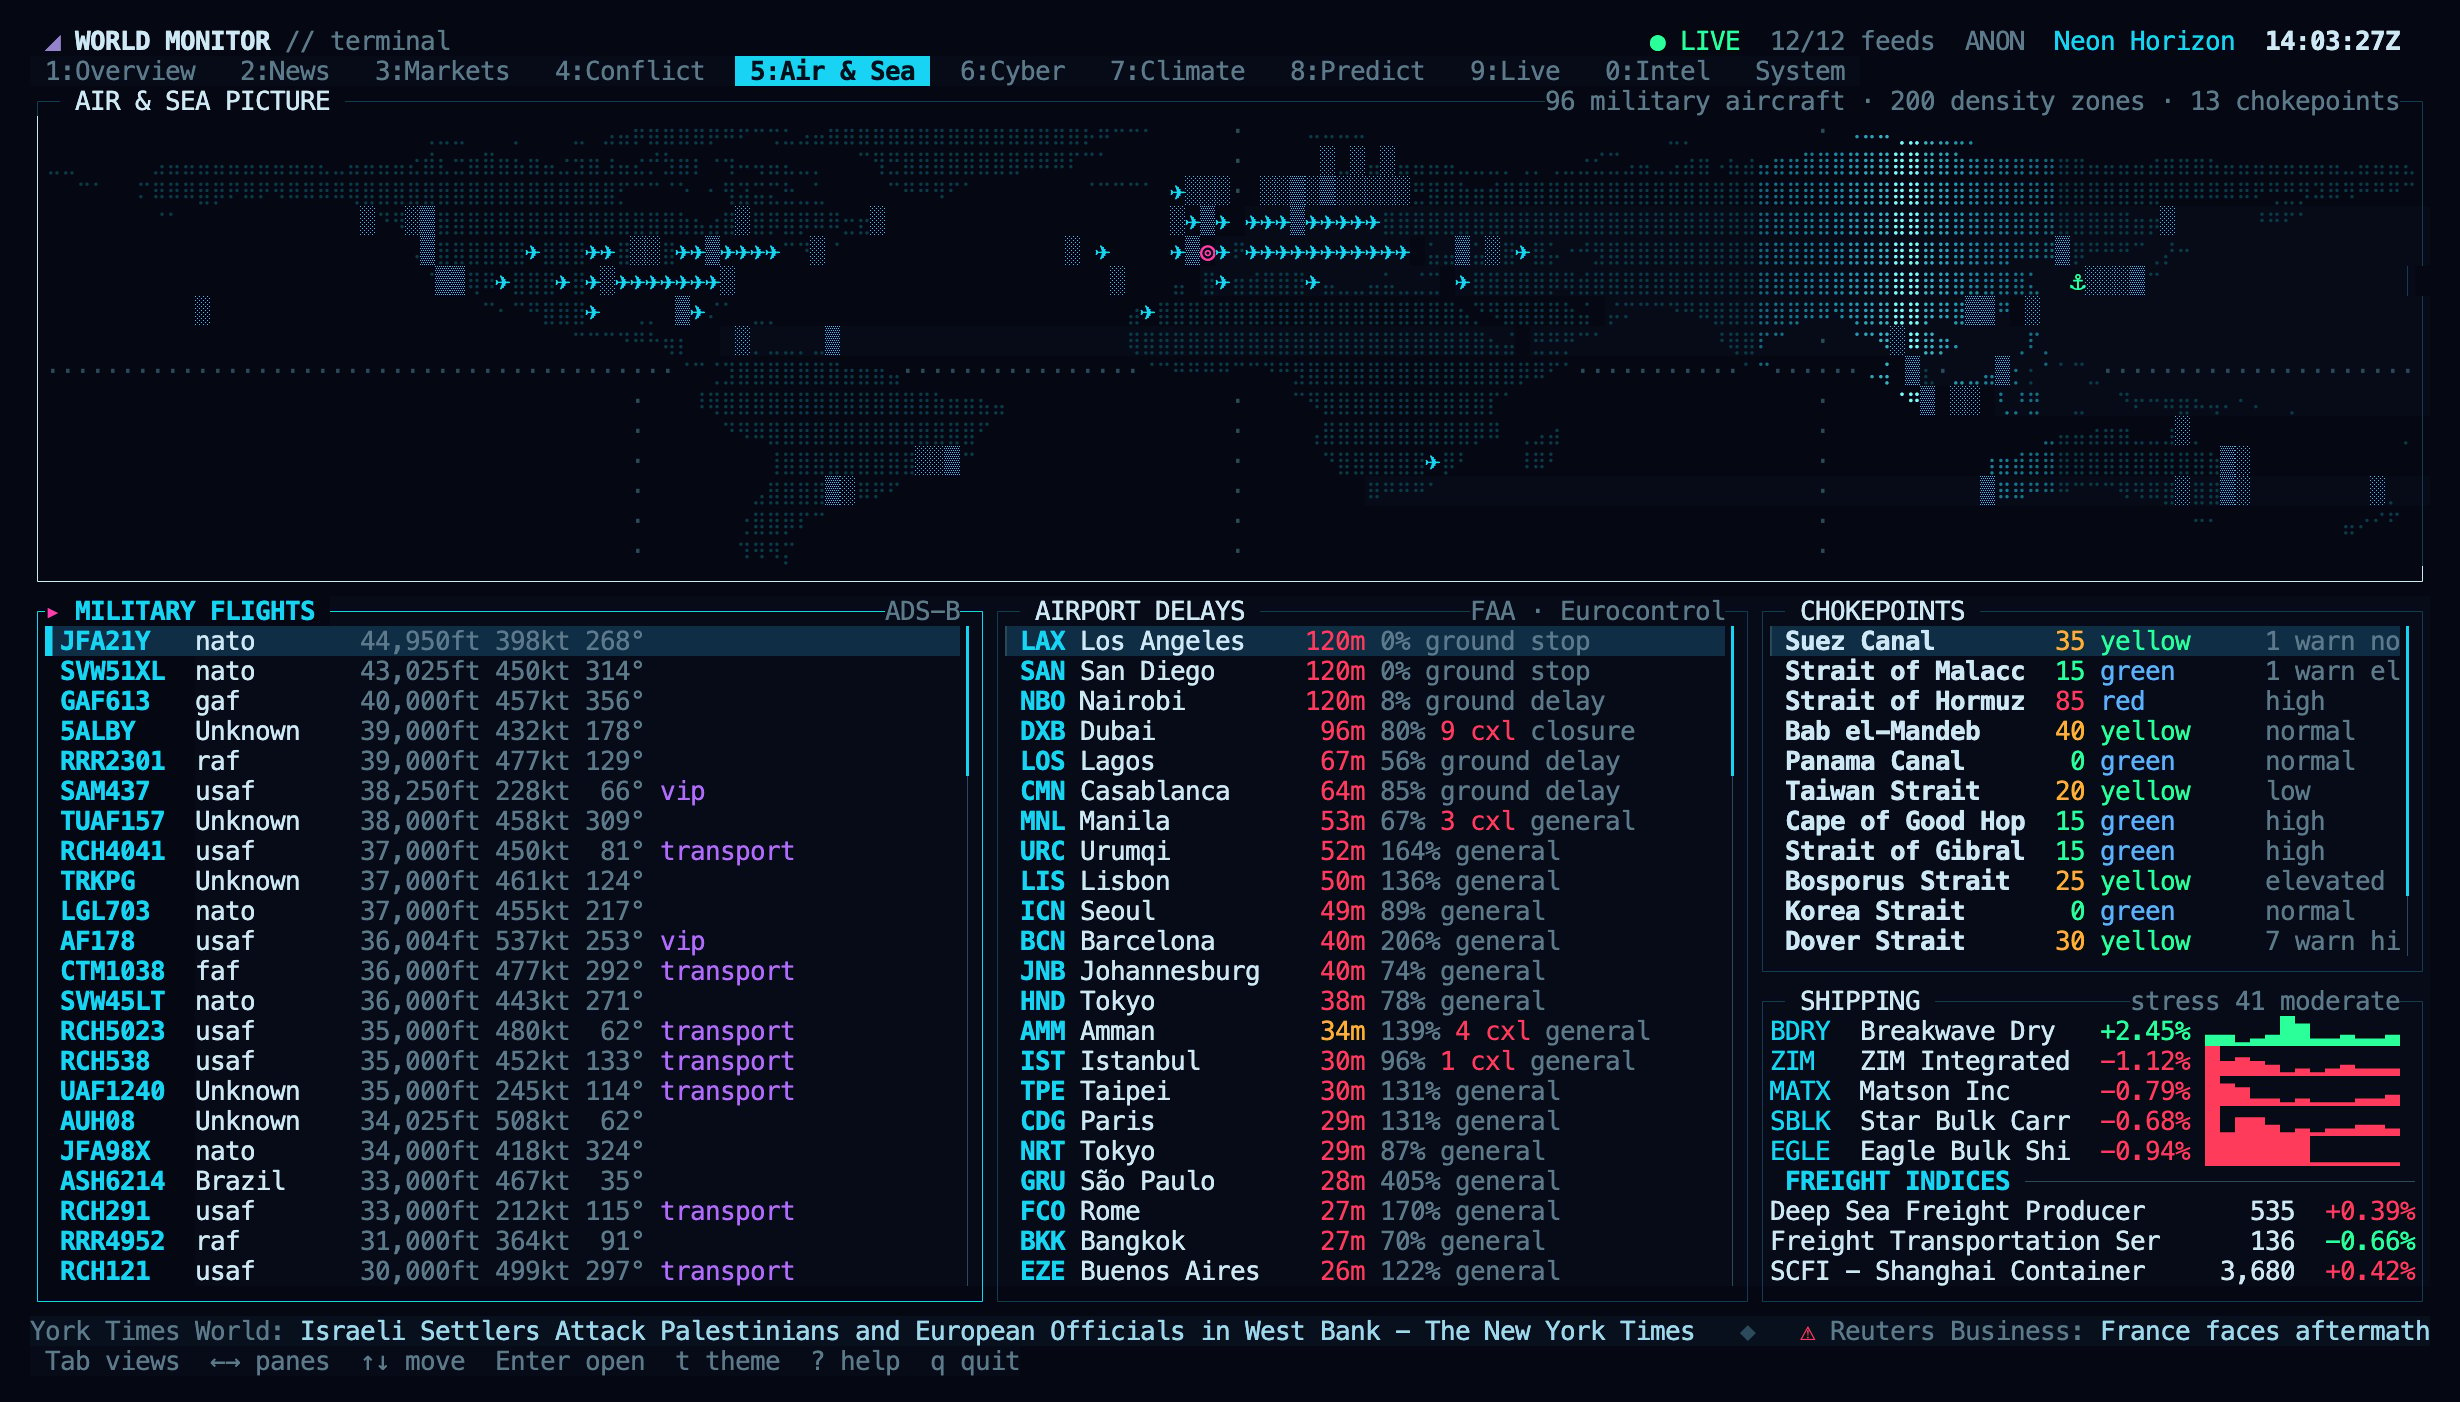
Air & Sea: live military aircraft plotted on the map, sorted by altitude, with airport delays, chokepoint status, shipping stress and freight indices.
Cyber
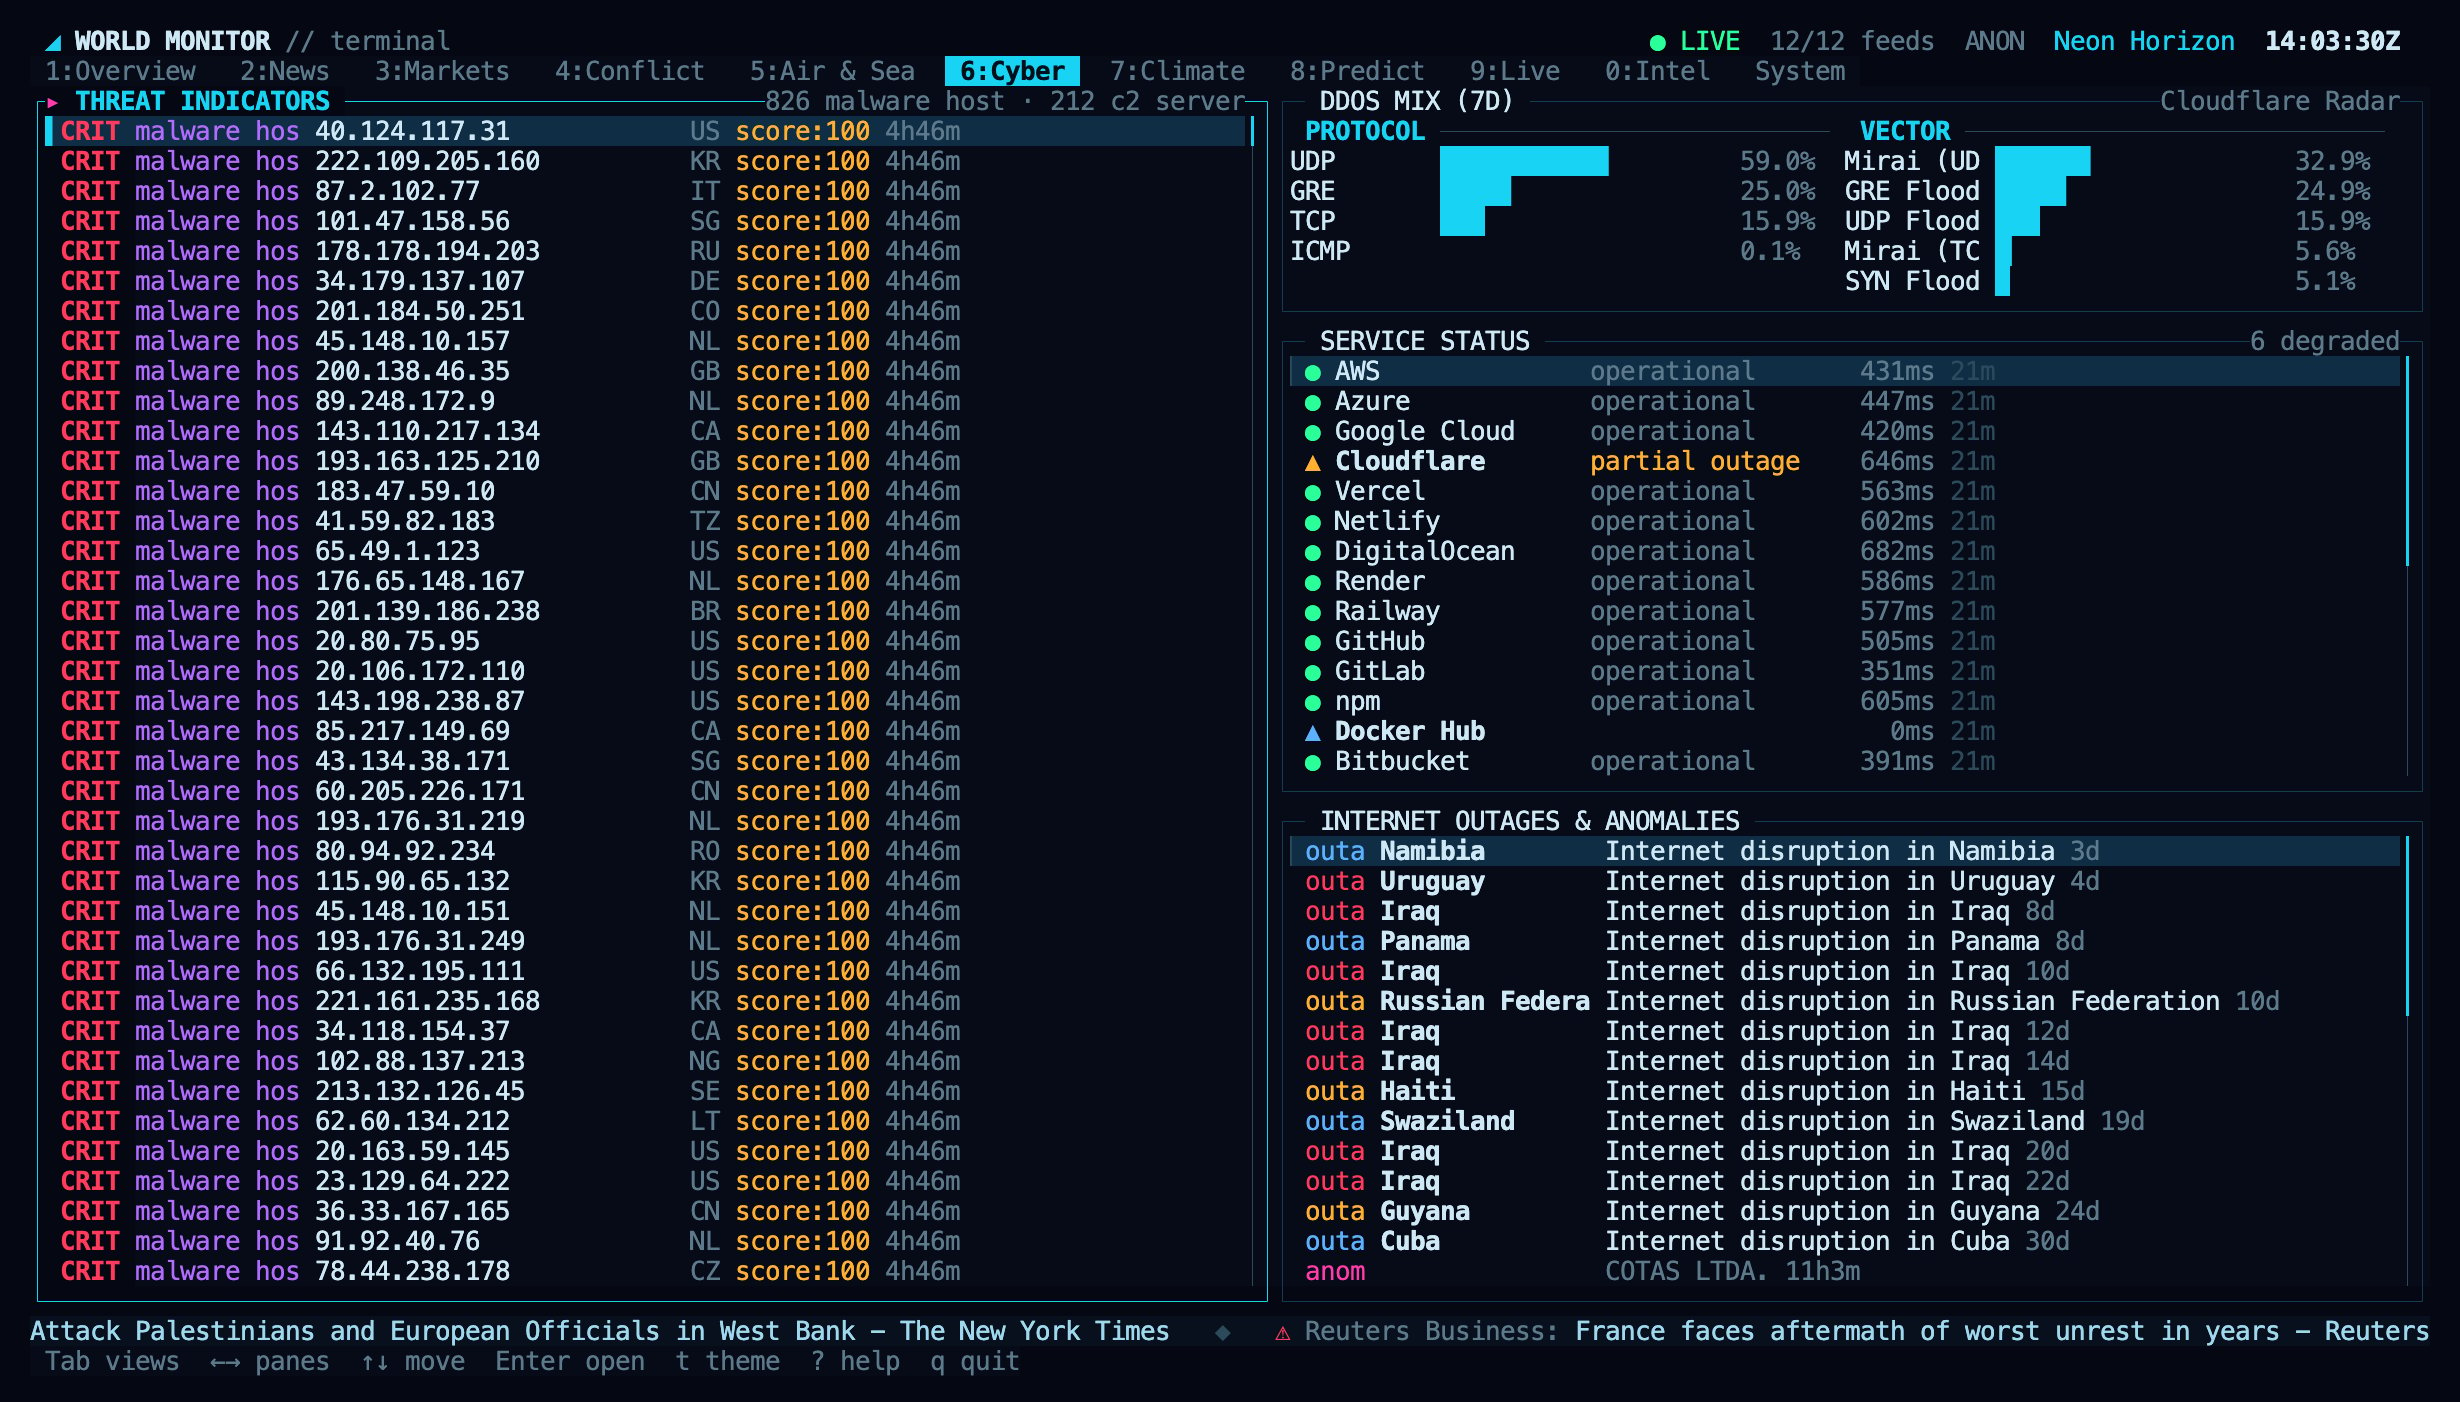
Cyber: threat indicators, DDoS mix, service status and internet outages.
Climate
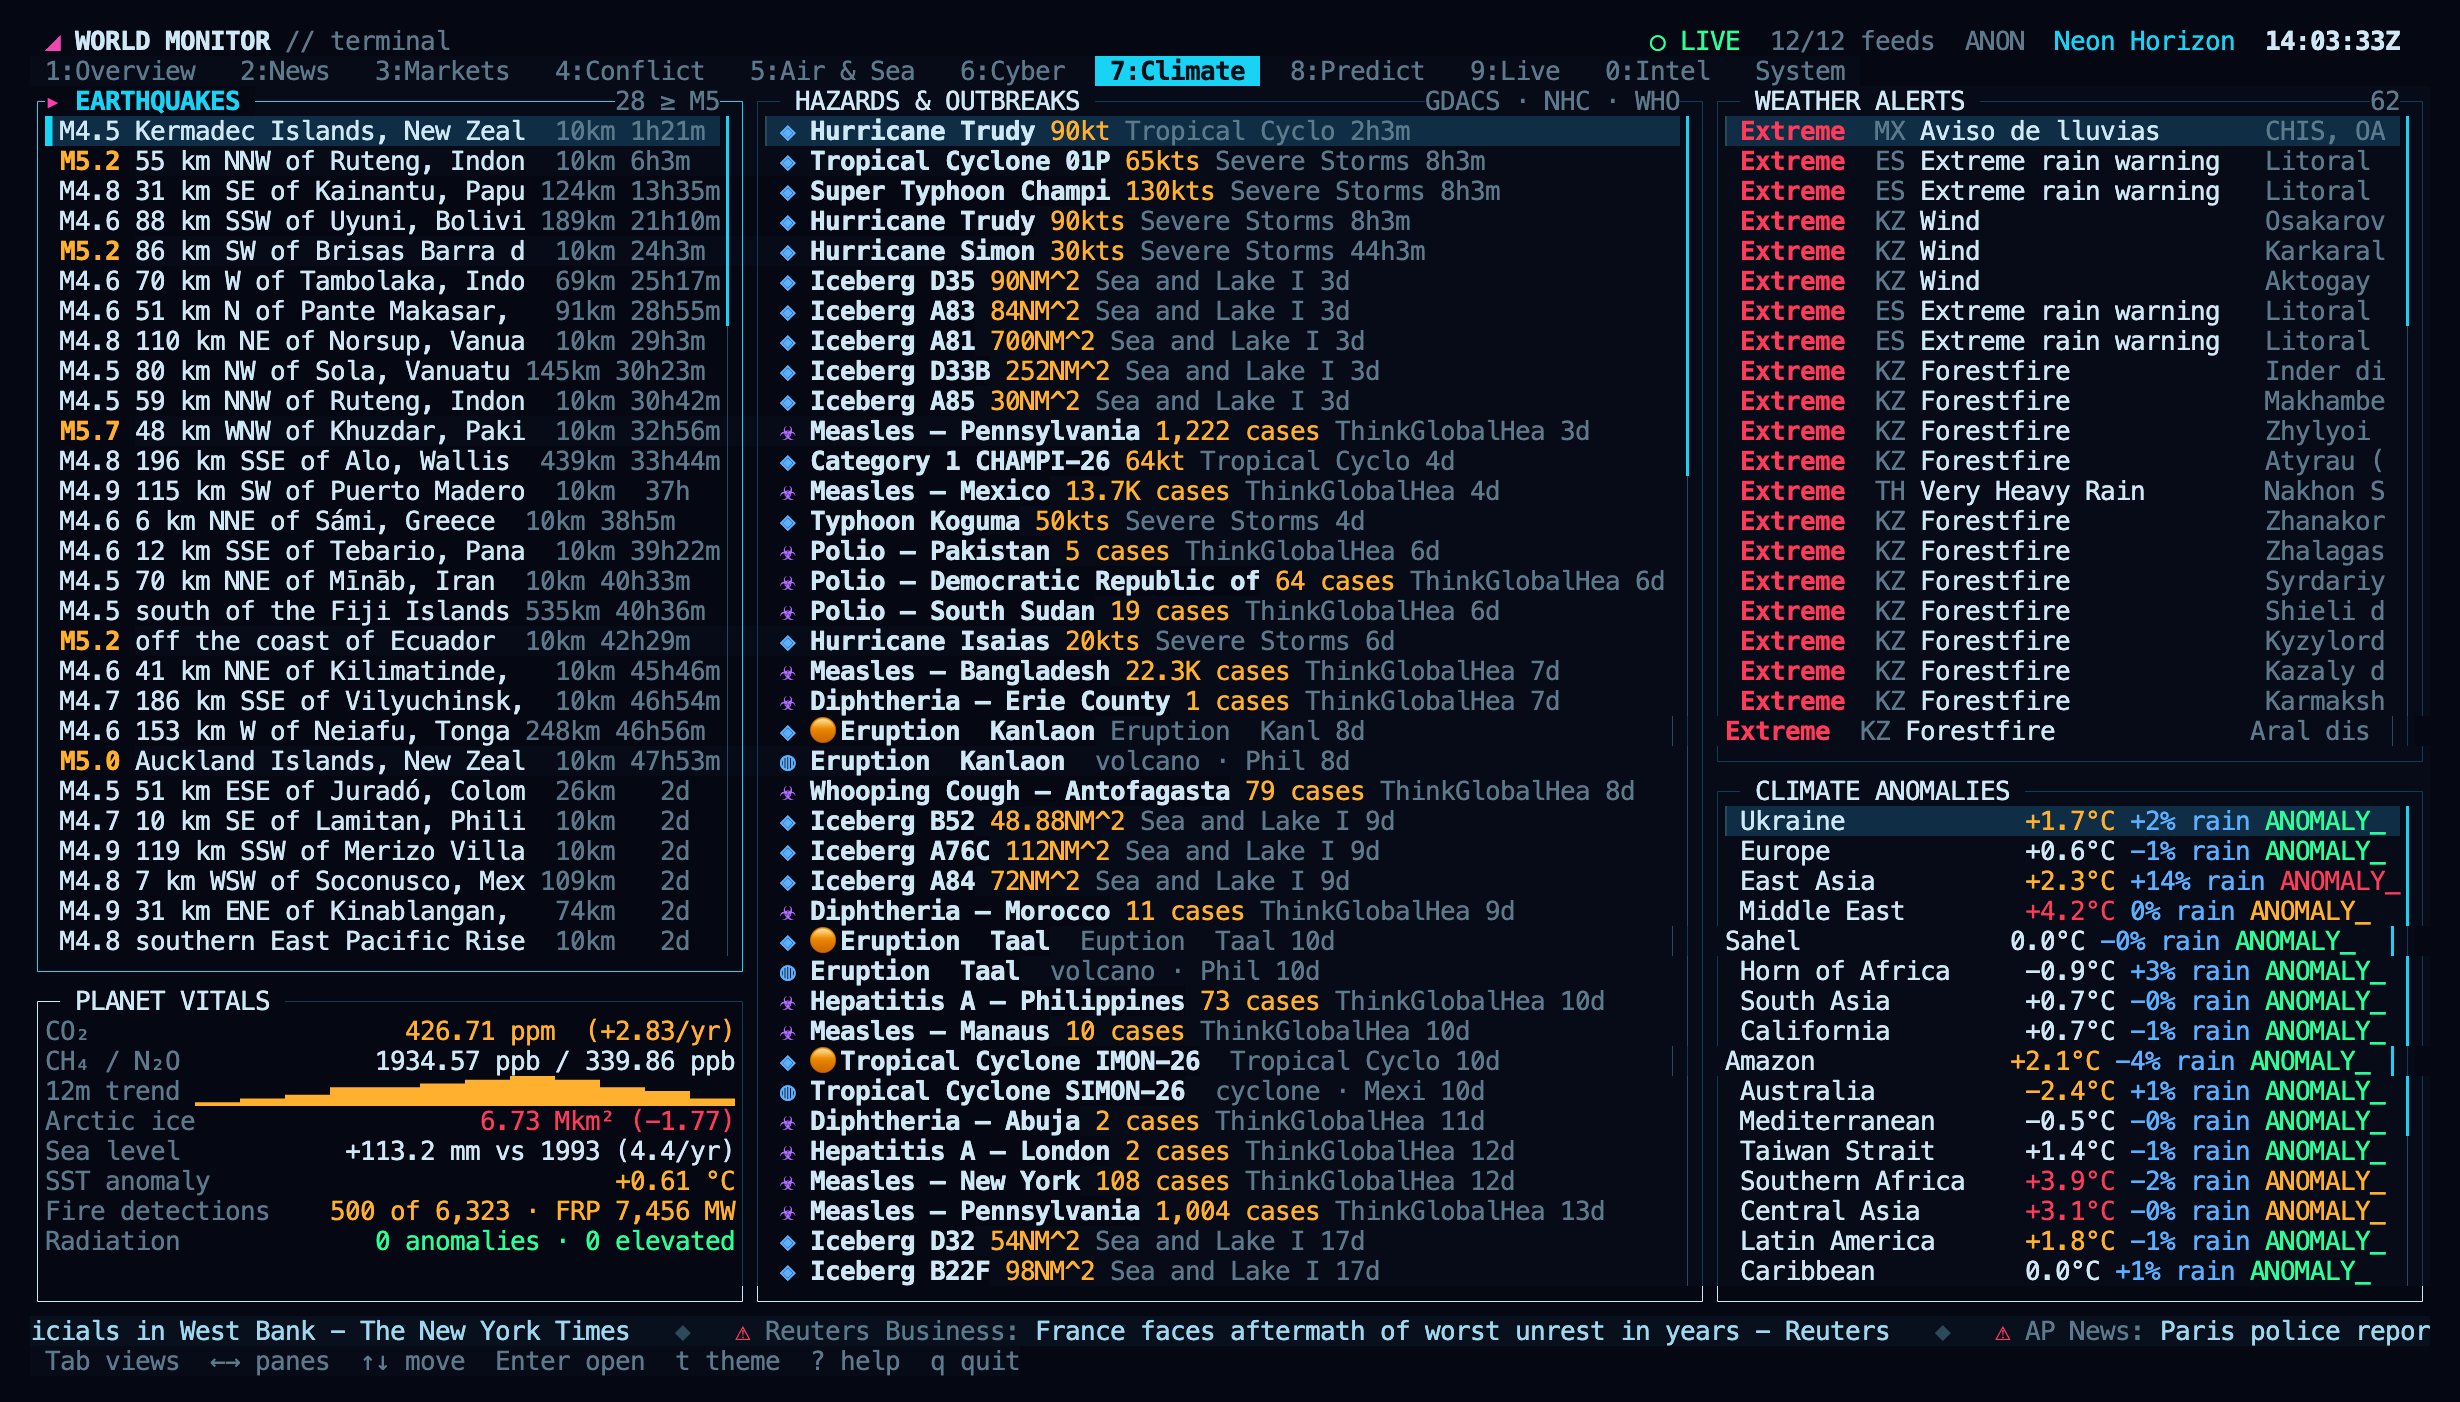
Climate: earthquakes, natural hazards, weather alerts and planetary vitals.
Predict
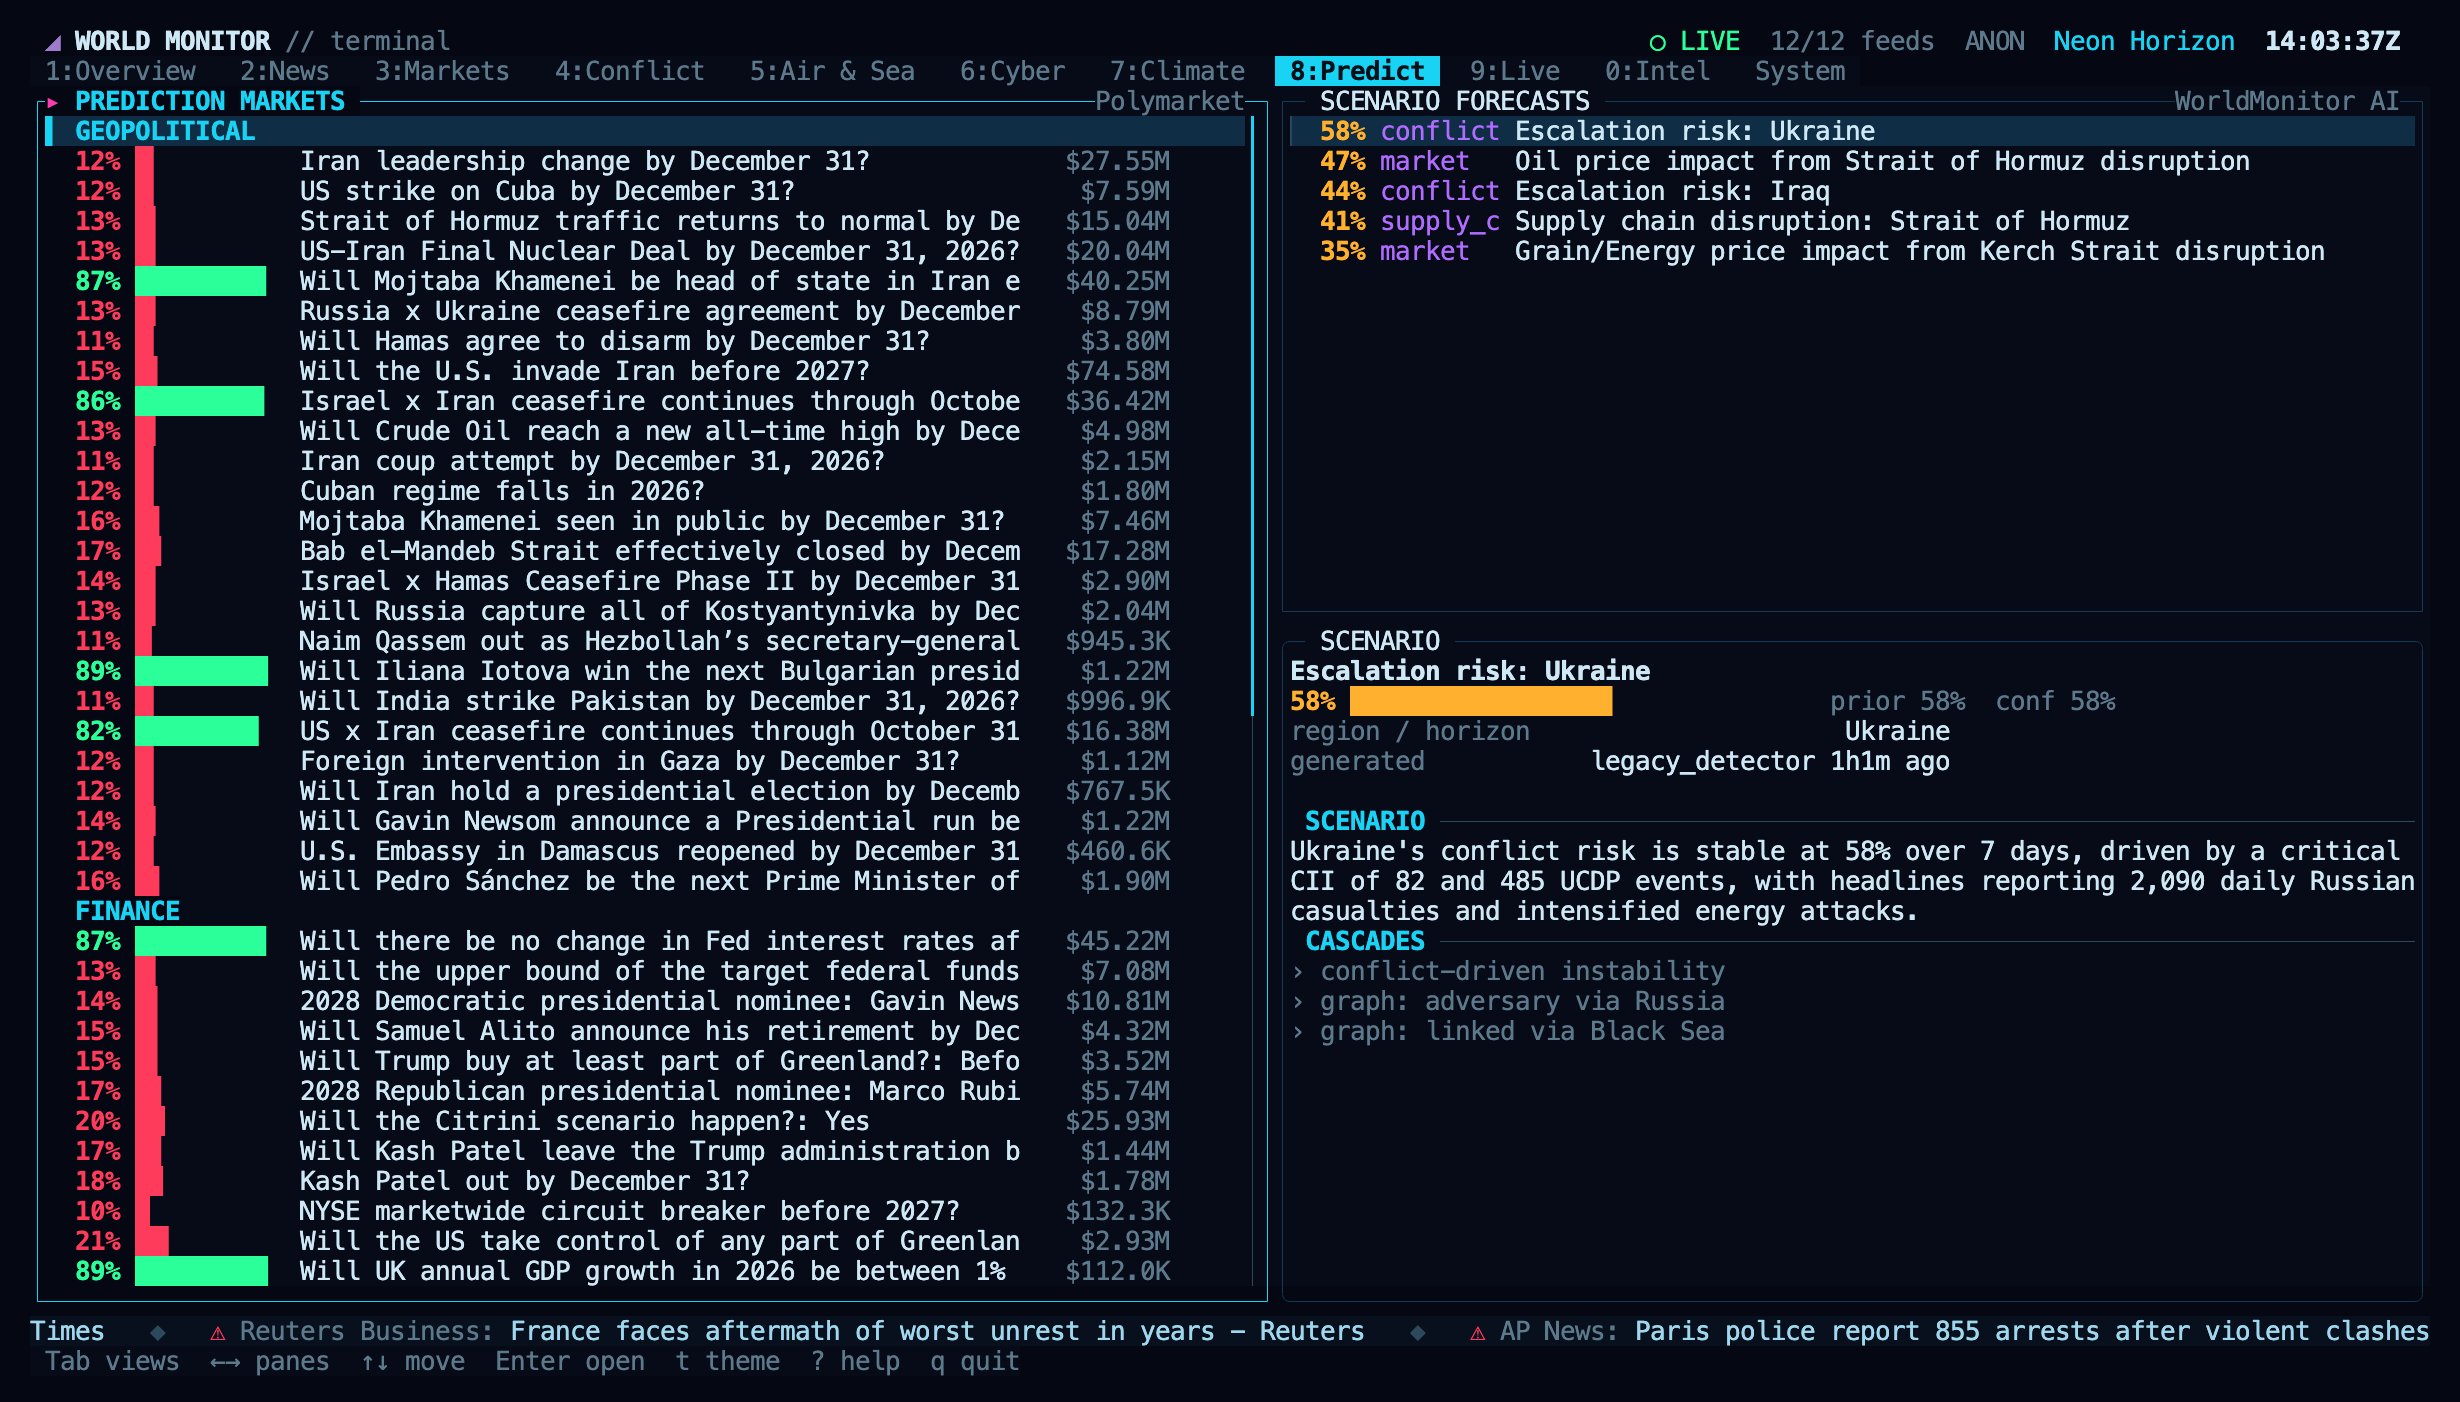
Predict: prediction markets grouped by domain, and AI scenario forecasts.
Live
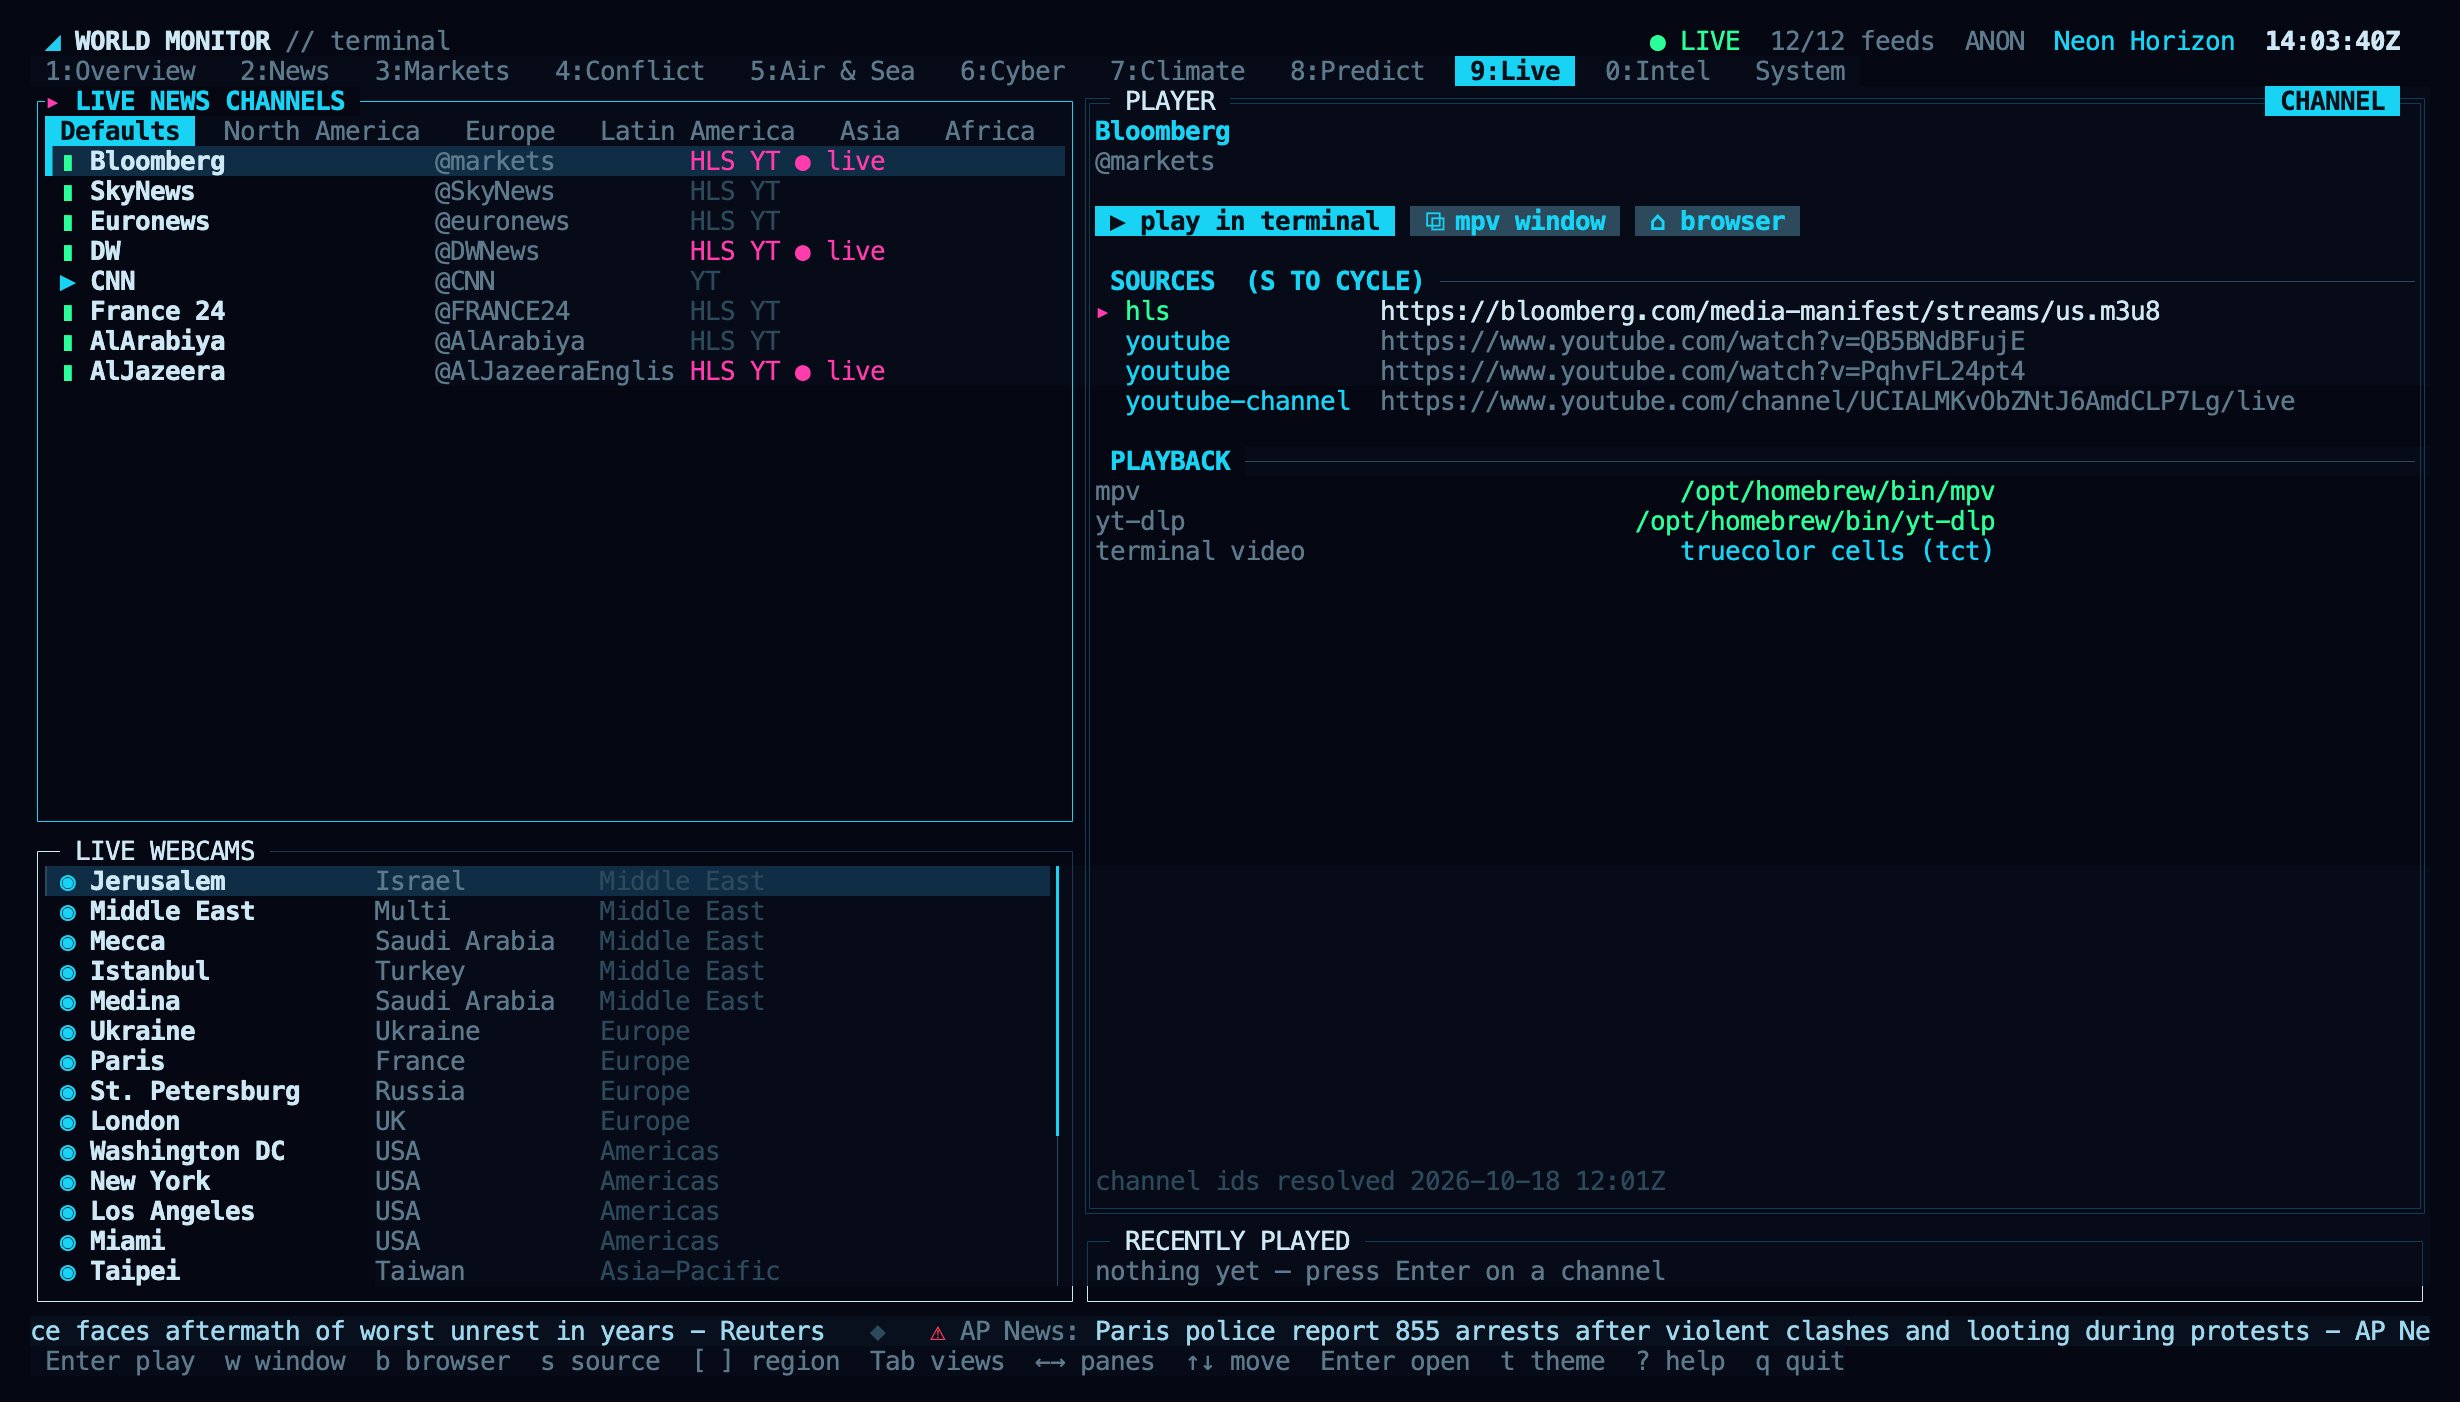
Live: the dashboard's news channels and webcams, with each channel's stream sources and the local player status.
q in mpv, or Ctrl+C, to stop playback and return to the dashboard.
Install the player on macOS with brew install mpv yt-dlp, or with your Linux package manager. Without mpv, Enter opens the stream in your browser.
Intel
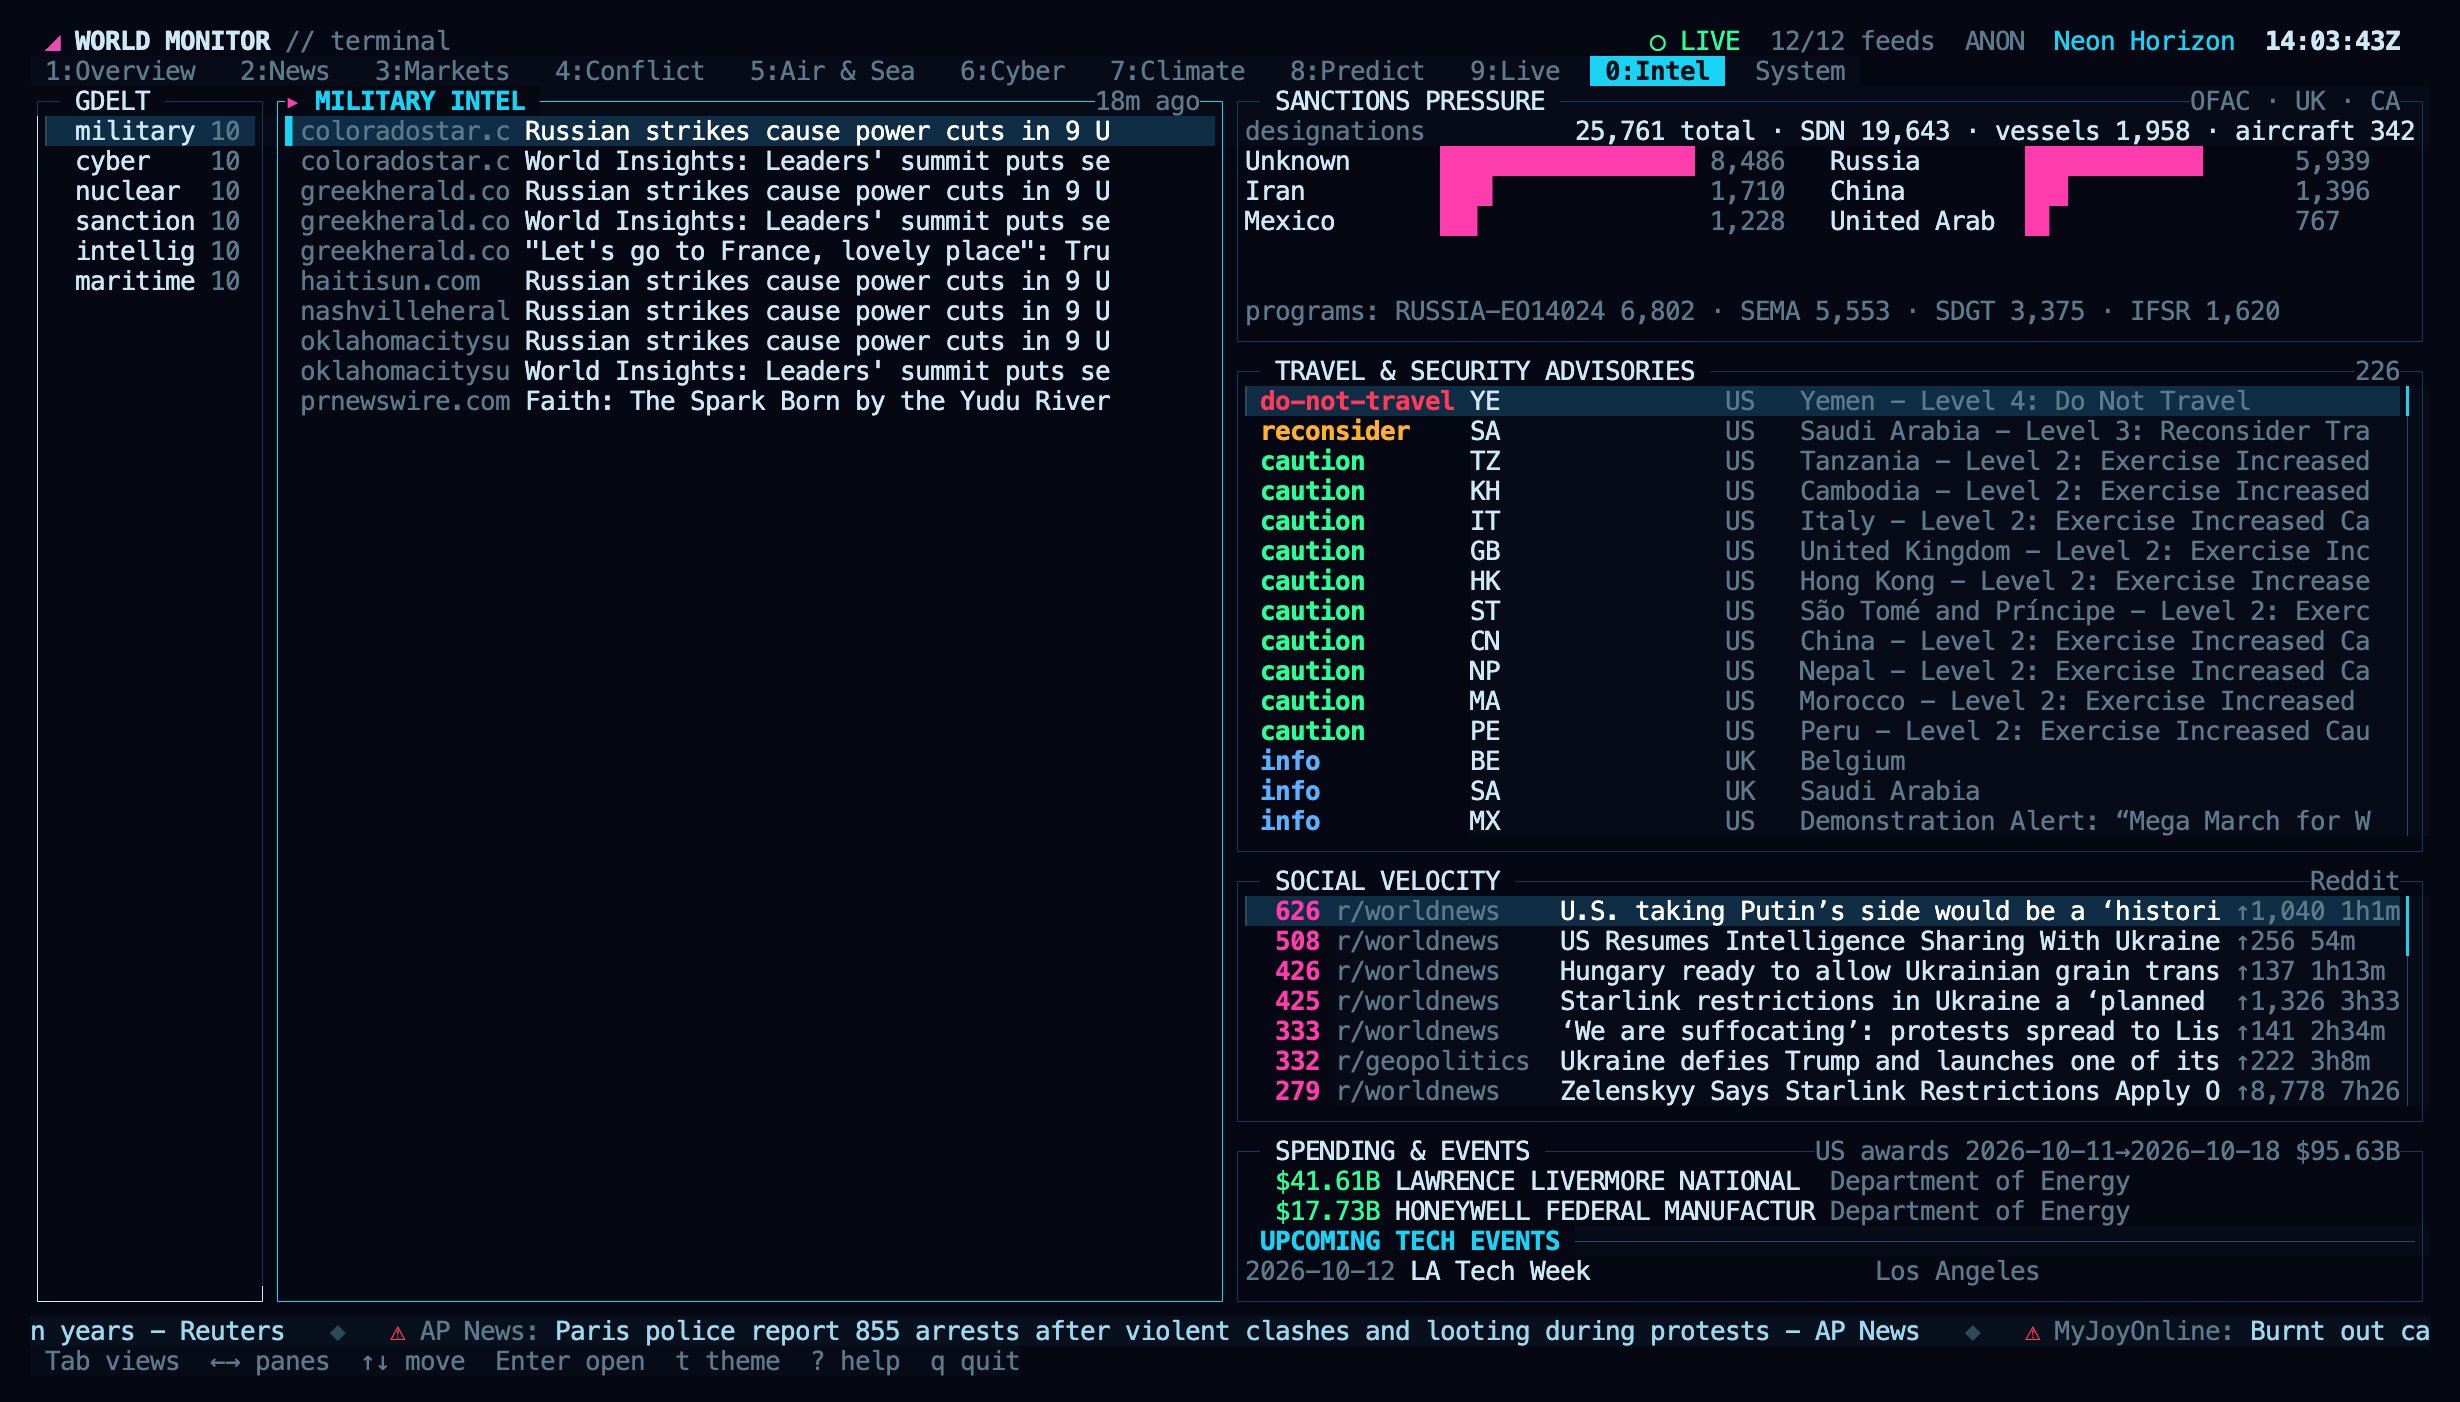
Intel: GDELT topic feeds, sanctions pressure, travel advisories and social velocity.
System
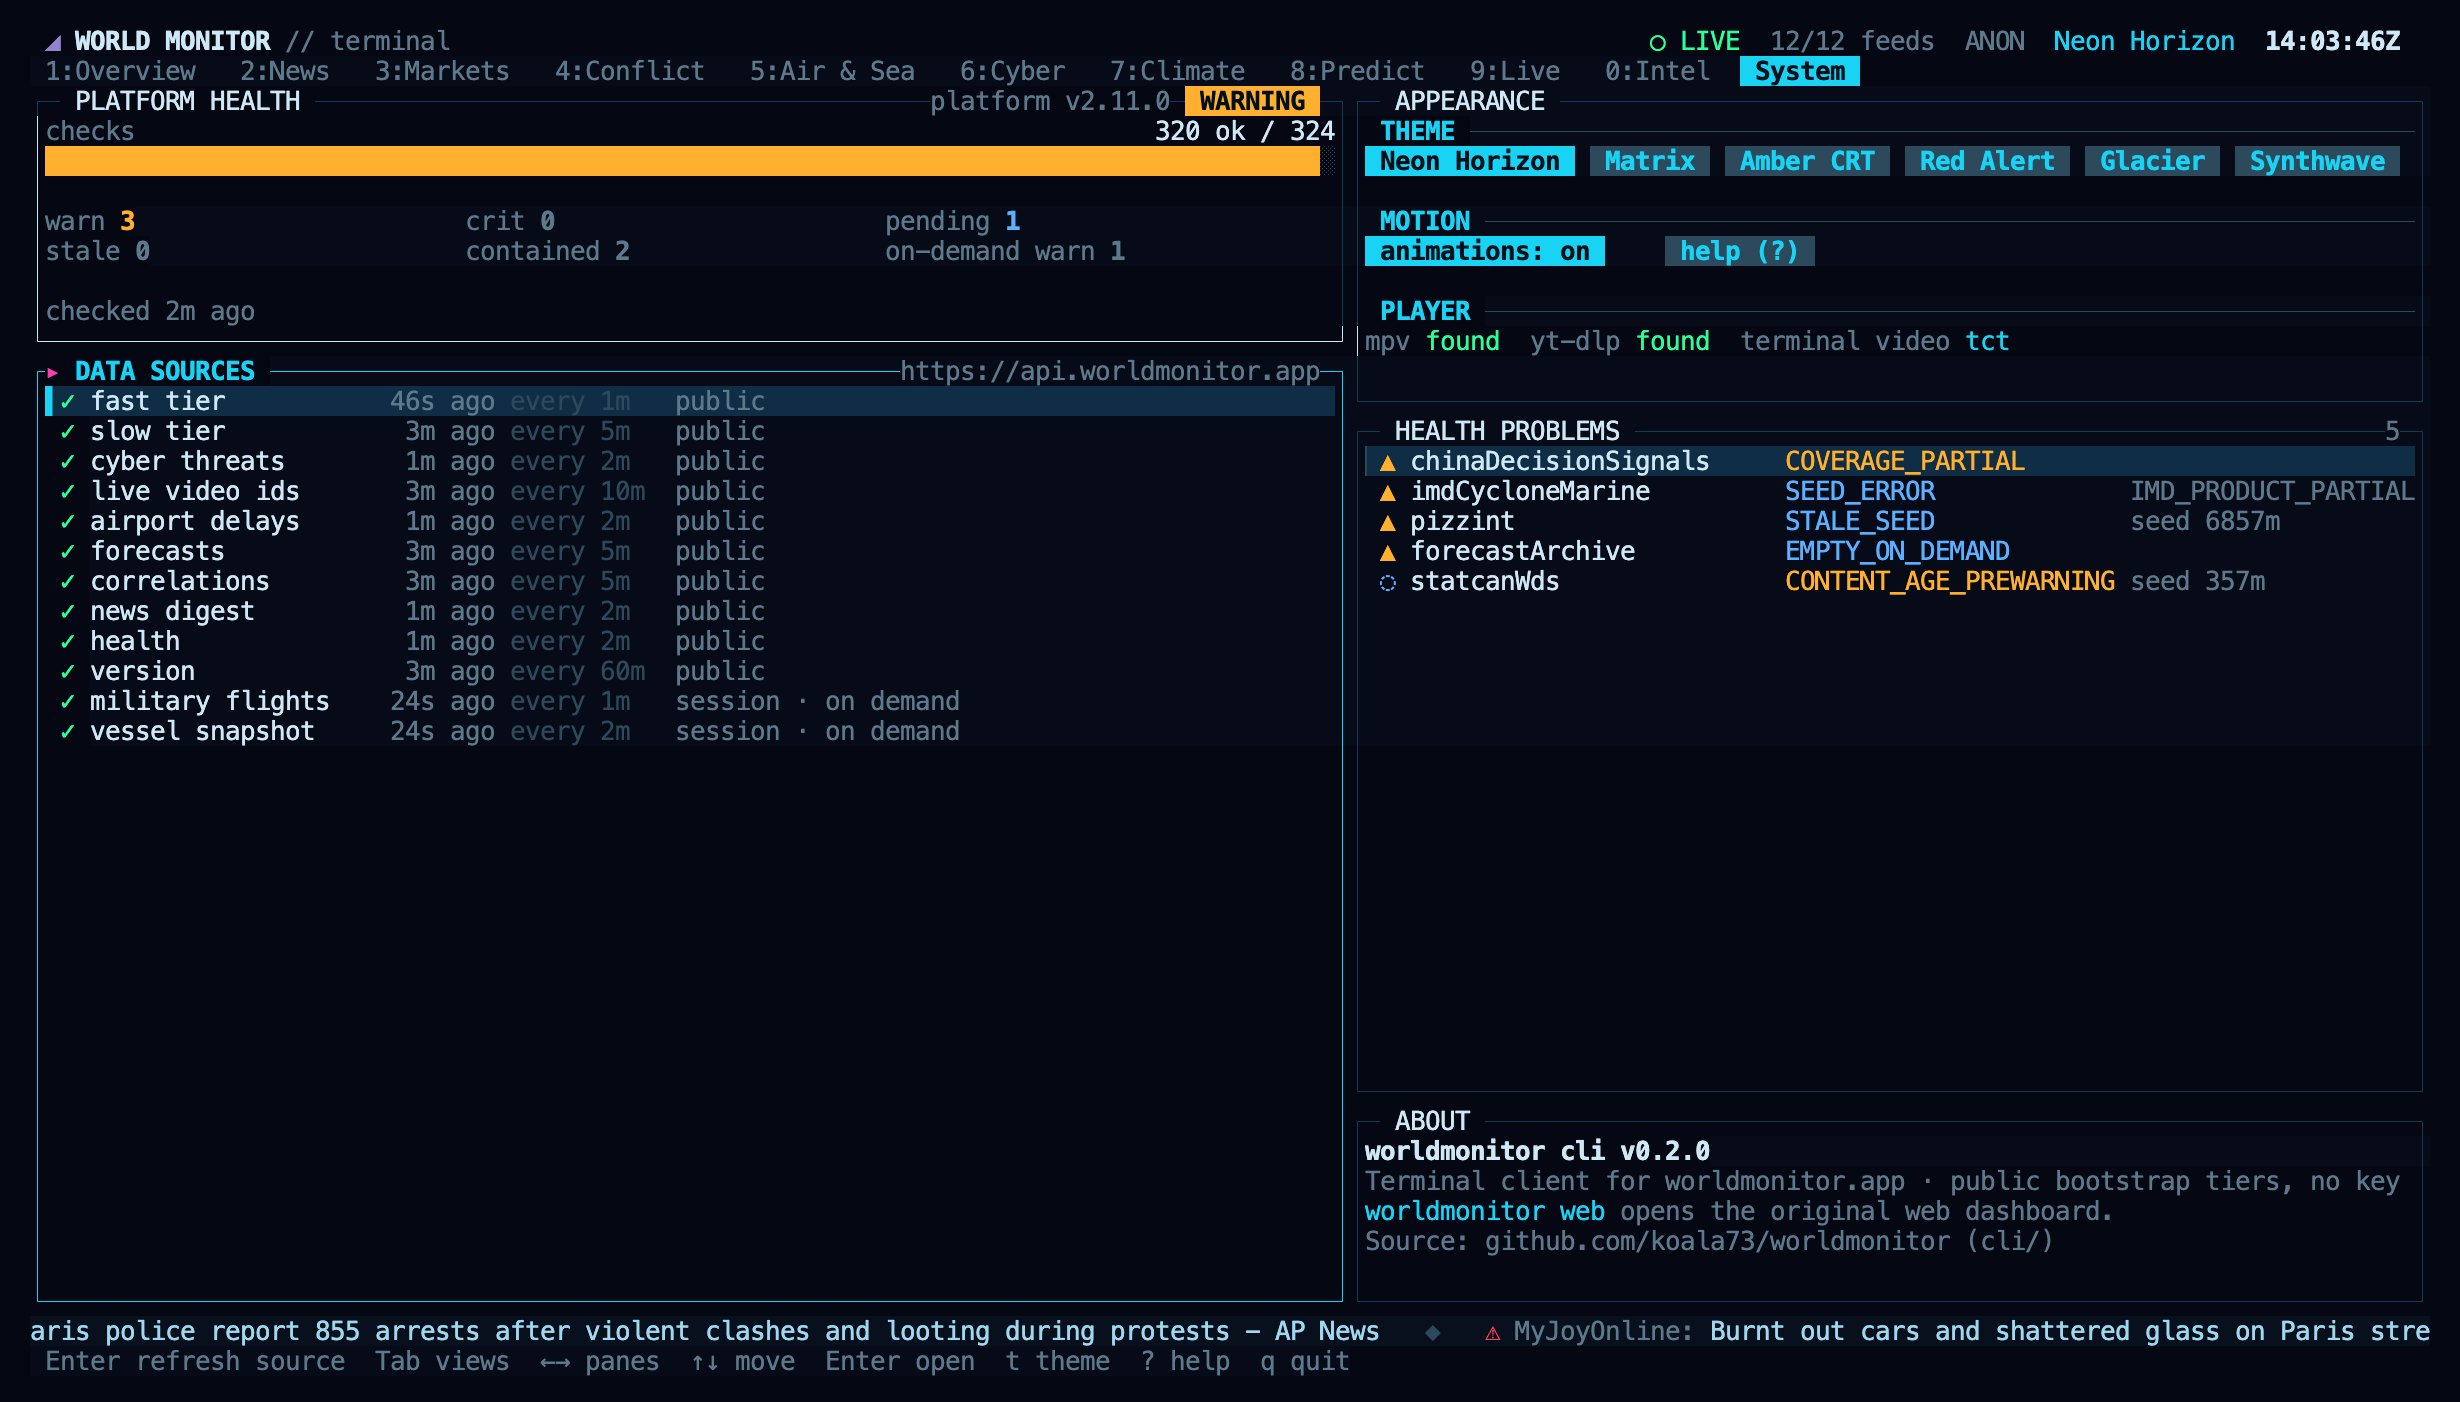
System: platform health, the freshness and refresh interval of every data source, appearance settings and the video player status.
r refreshes the current view immediately.
Controls
Every action works from the keyboard, and tabs, rows and buttons are clickable. The mouse wheel scrolls lists. Press? at any time for the key reference.
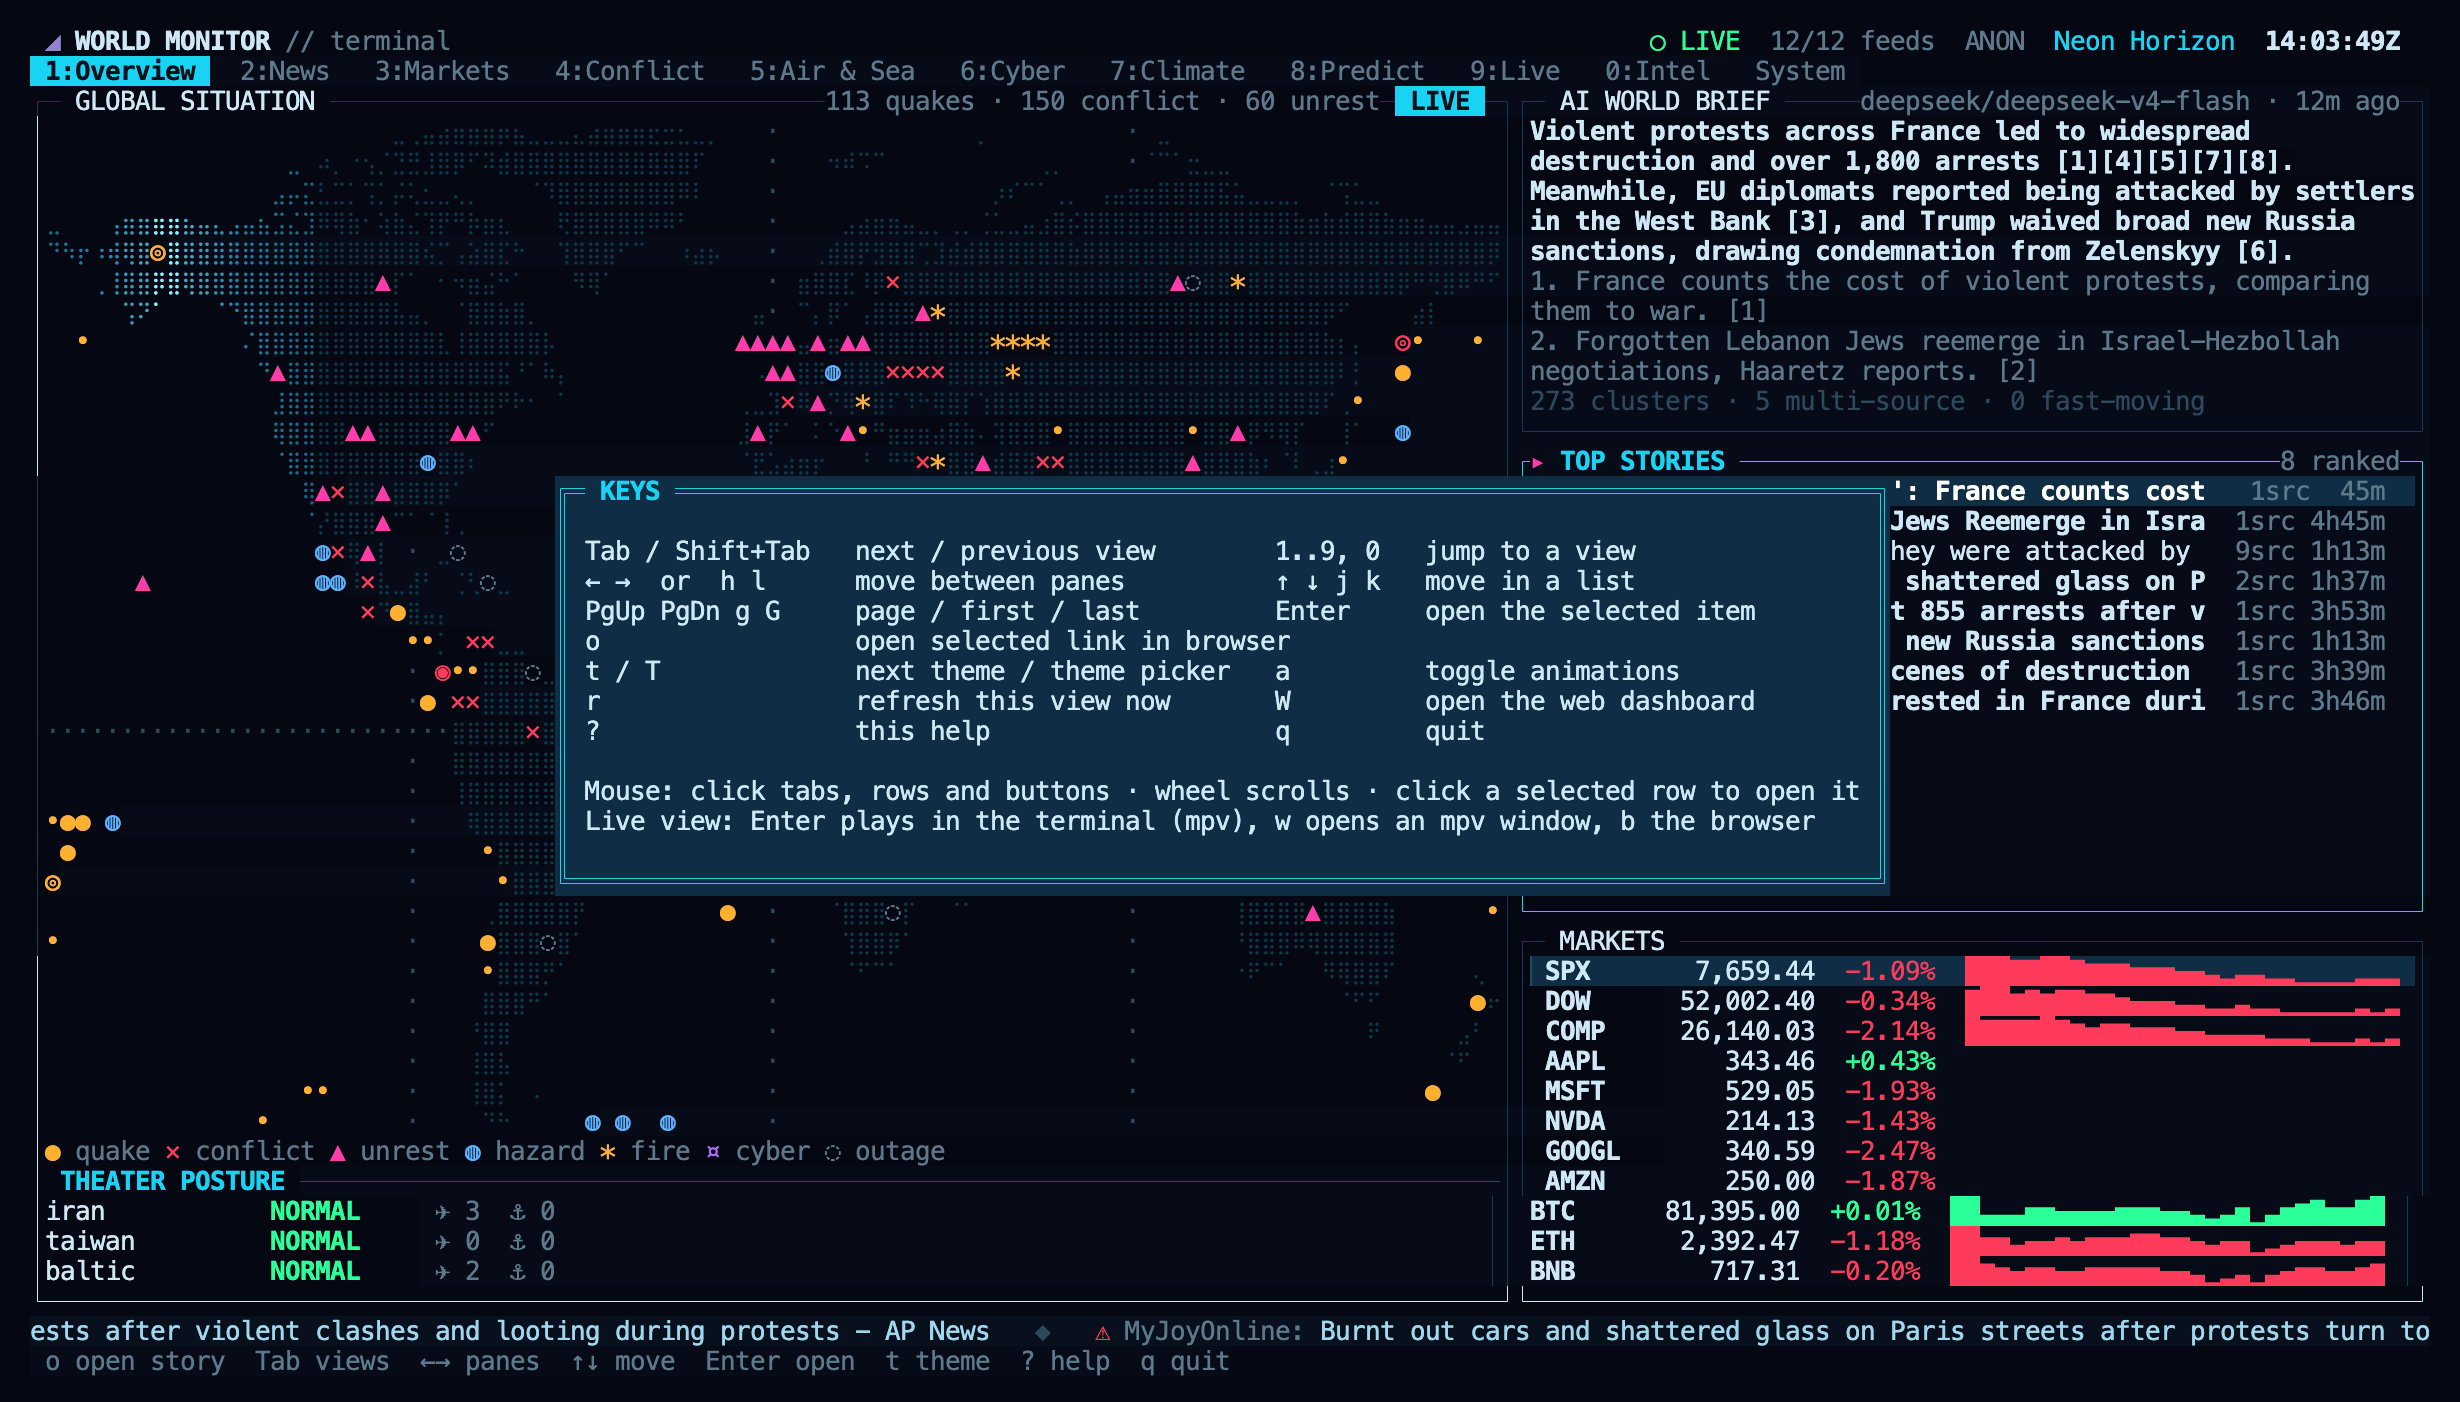
The help overlay (?) lists every key.
Themes
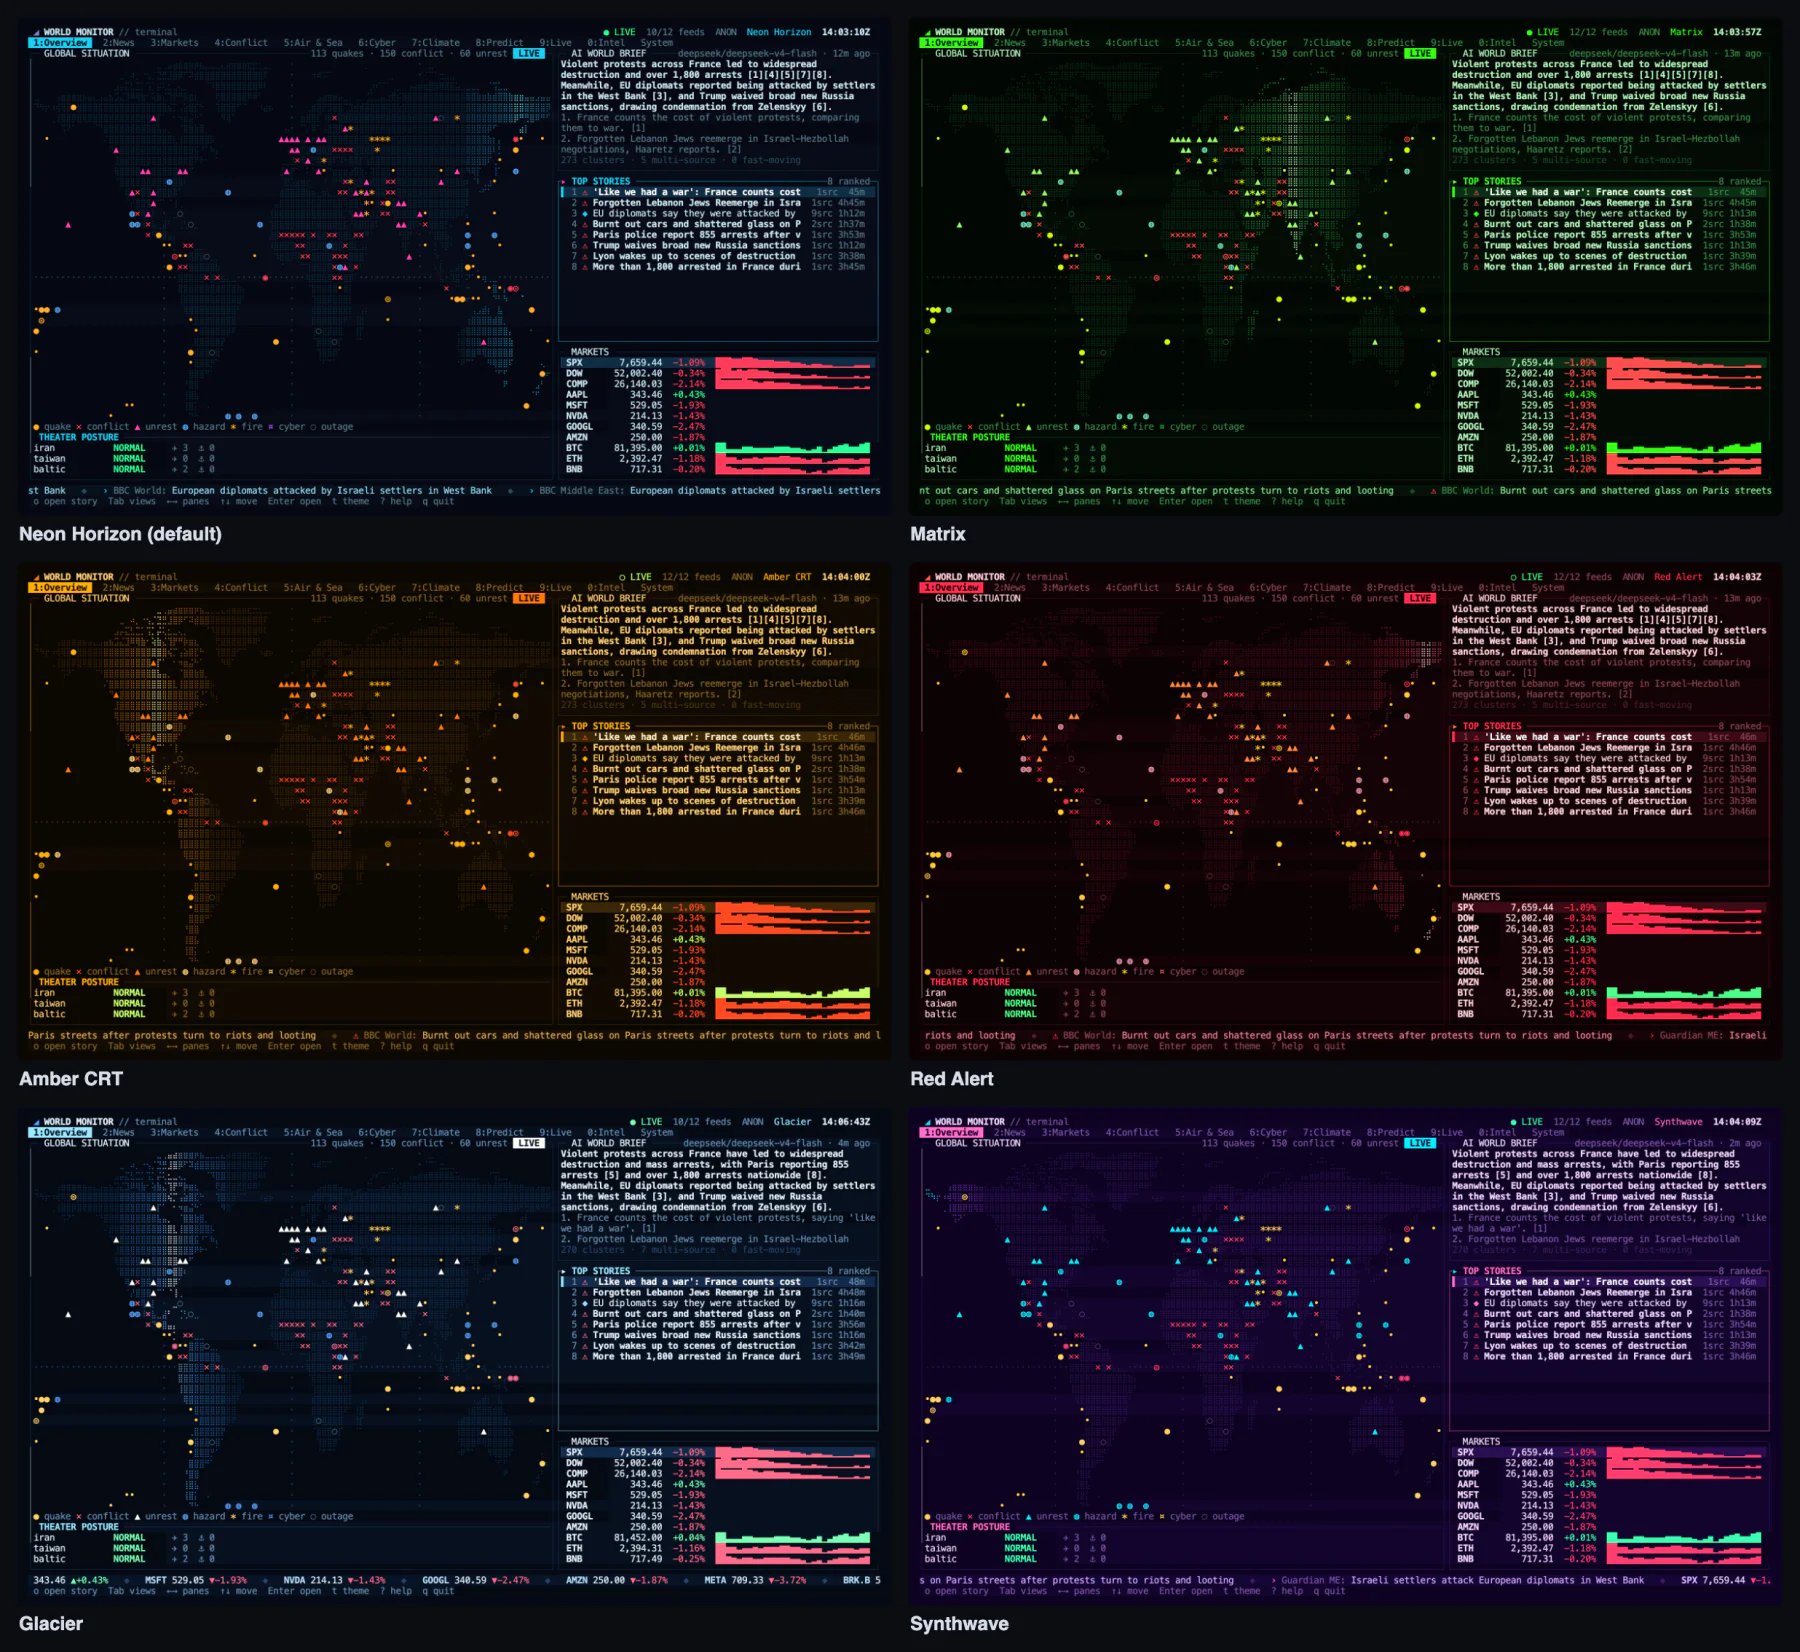
The colour themes: Neon Horizon (default), Matrix, Amber CRT, Red Alert, Glacier and Synthwave.
t to cycle themes, or T to open the picker. The picker previews each theme as you move through the list; Enter keeps it and Esc returns to the theme you had.
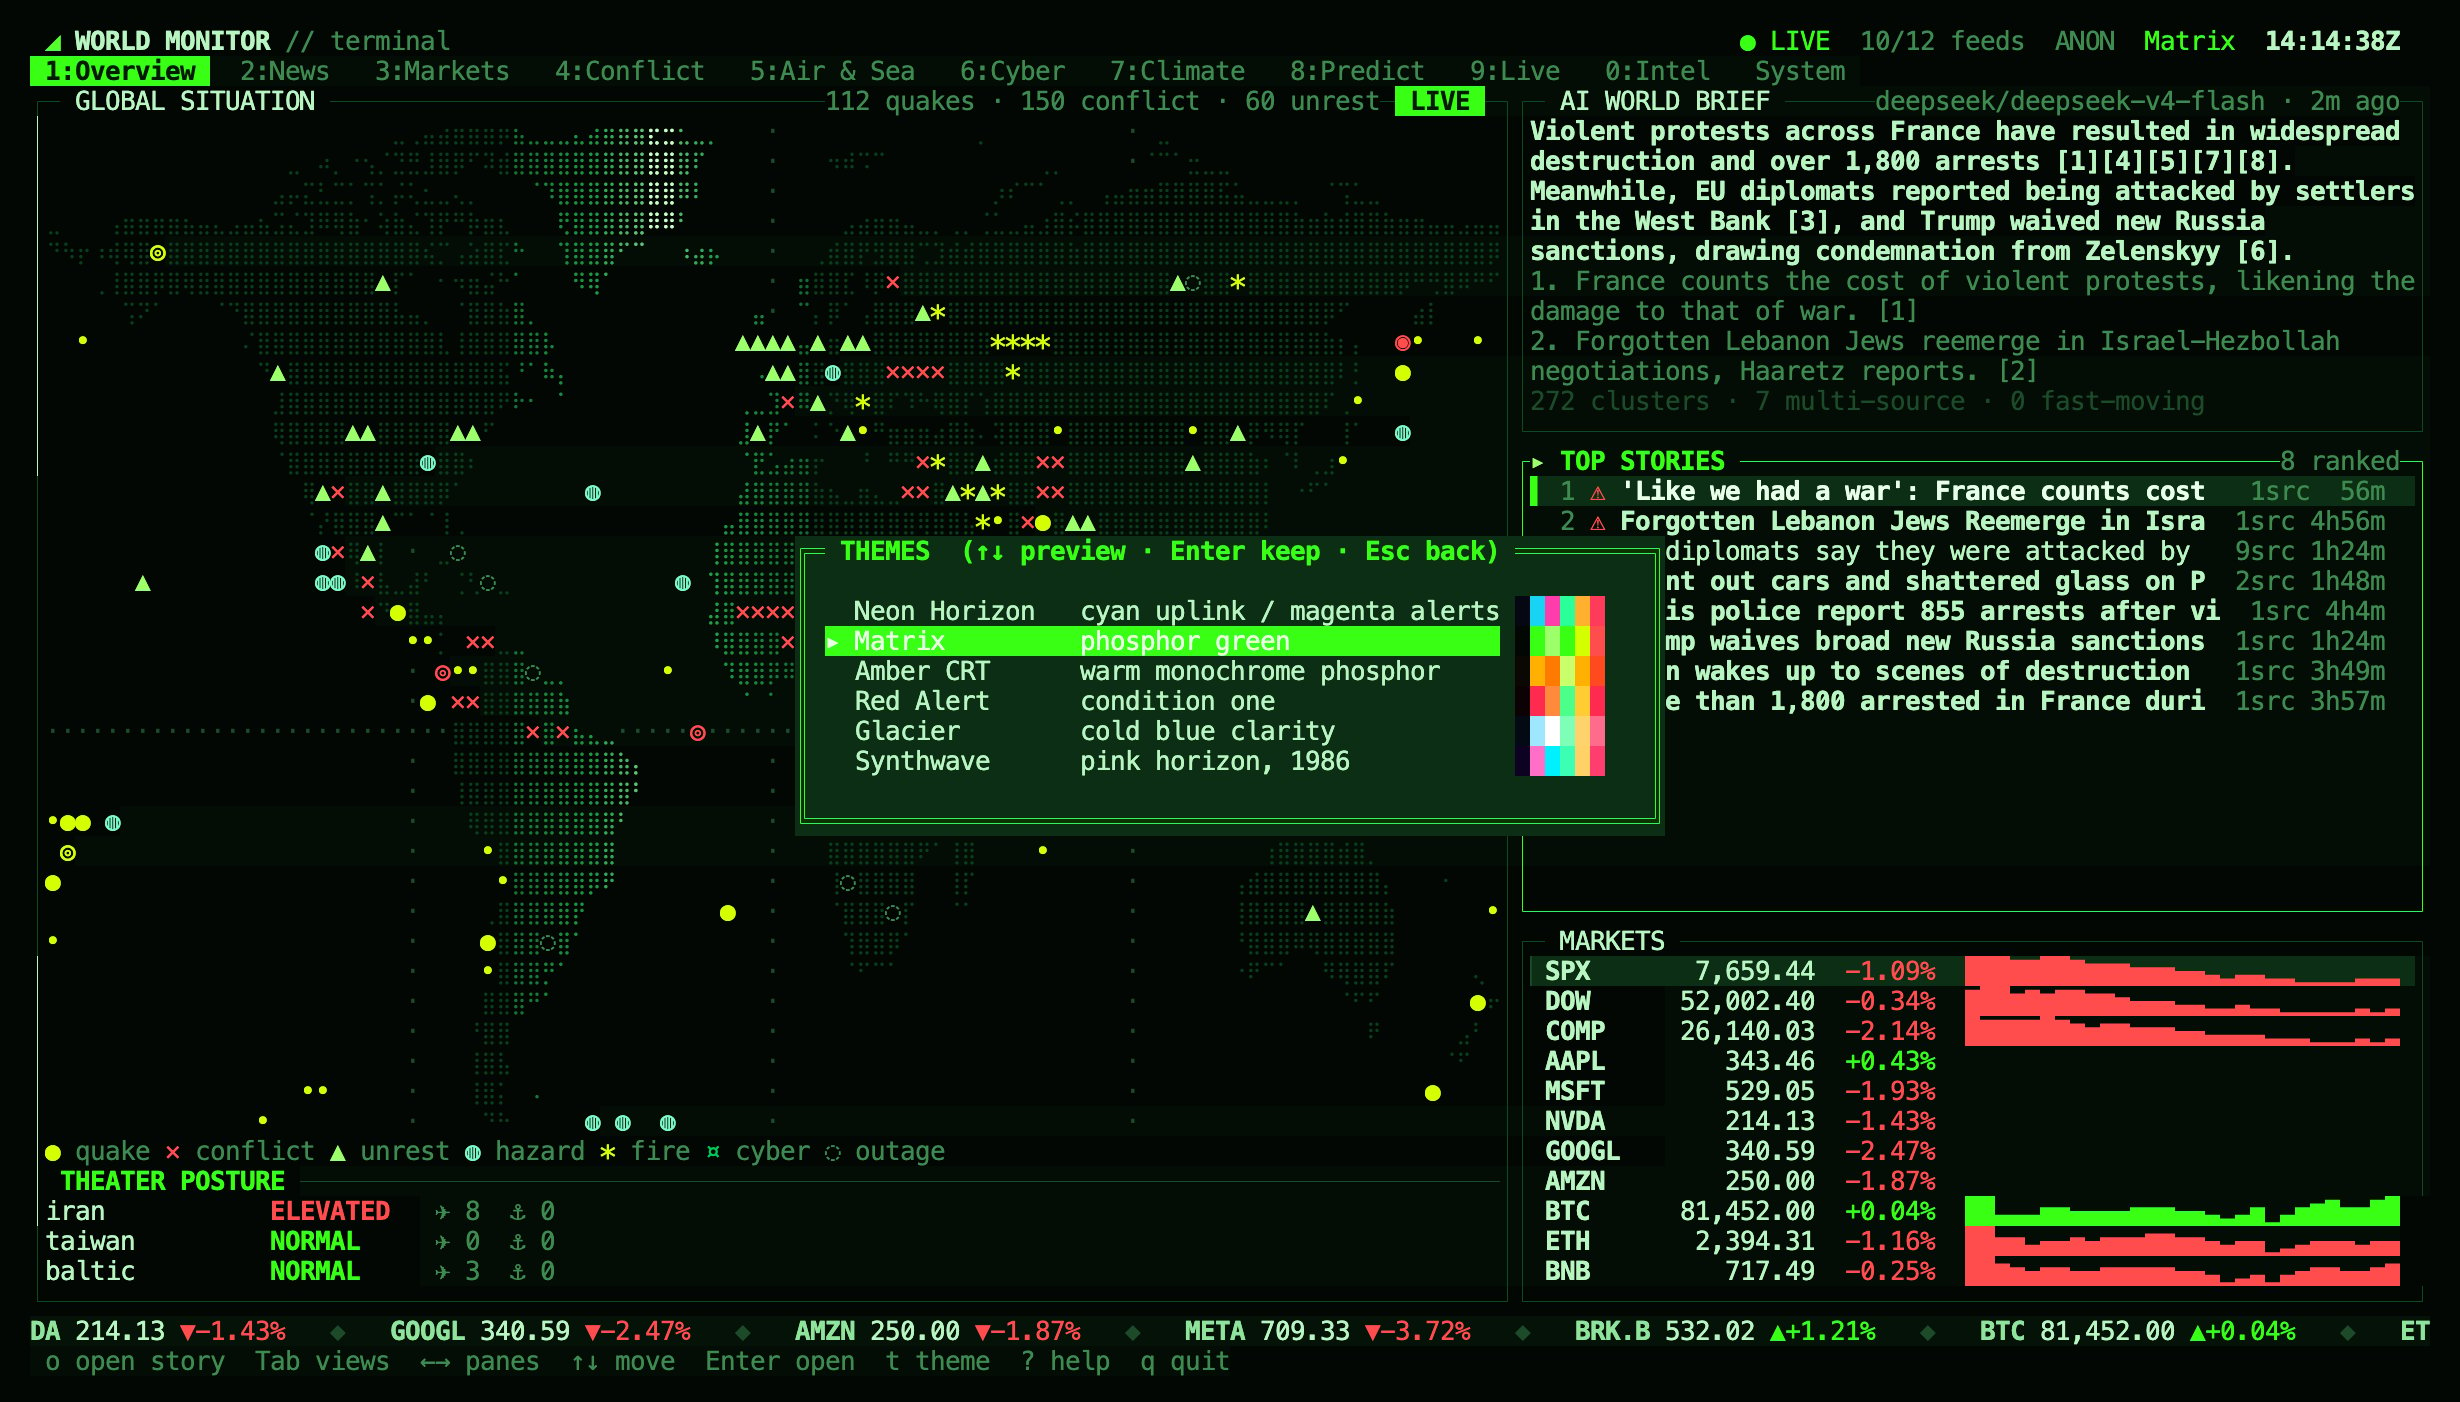
The theme picker previews the highlighted theme across the whole dashboard.
$XDG_CONFIG_HOME/worldmonitor/tui.json (usually ~/.config/worldmonitor/tui.json). The file never contains your API key.
Options
worldmonitor web has its own flags, listed under Open the web dashboard. On every other command, --theme, --url and similar flags are passed through to the API as parameters.
Data and privacy
The dashboard reads the same public endpoints as the web dashboard: the public bootstrap tiers, the news digest, the compact health endpoint and the version endpoint. Military flights and vessel snapshots use an anonymous, short-lived session token, minted the same way the browser mints one. WhenWORLDMONITOR_API_KEY or --api-key is set, that key is sent instead.
Data refreshes in the background: the fast tier every minute, news and health every 2 minutes, the slow tier every 5 minutes. Flights and vessels refresh only while the Air & Sea view is open. A source that fails waits before it retries, and the System view shows its error.
Open the web dashboard
npm run dev) instead and opens the local URL.
Troubleshooting
- The map or borders show boxes or question marks. Your font lacks braille or box-drawing characters. Switch to a current terminal font such as JetBrains Mono, Fira Code, SF Mono, Menlo or Cascadia Code.
- Colours look washed out or wrong. Your terminal may not report truecolor support. Set
COLORTERM=truecolor, orWM_TUI_COLOR=256if your terminal only supports 256 colours. - The mouse does not work inside tmux. Enable it with
set -g mouse onin your tmux configuration. - “The dashboard needs an interactive terminal”. stdin or stdout is a pipe or file. Run
worldmonitor tuidirectly in a terminal, or use the scripting commands for automation. - Video does not play. Check the Player section of the System view. mpv and yt-dlp must be on your
PATH; otherwise streams open in the browser. - A view is empty. Open the System view to see which source failed and when it will retry.
rrefreshes the current view.
Related
- Command-Line Client: script briefs, risk scores and MCP tools from the same
worldmonitorcommand. - Desktop App: the full web dashboard as a native app.
- SDKs: Python, Ruby and Go clients.
- MCP server: connect an AI agent.